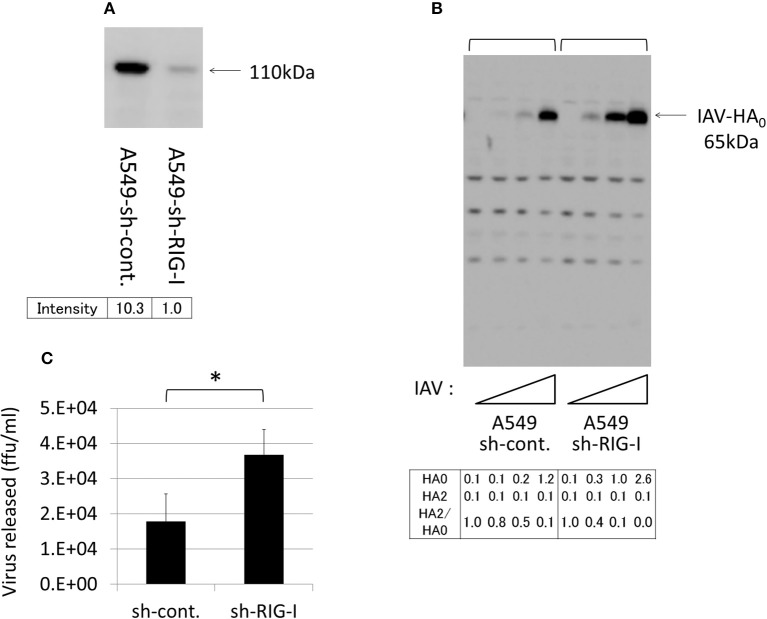
Figure 10.
Knockdown of RIG-I enhanced IAV proliferation in A549 cells. (A) A549 cells stably expressing the control shRNA (sh-cont.) or the shRNA confirmed as targeting RIG-I mRNA (sh-RIG-I) were generated by infection with an shRNA-expressing recombinant lentivirus and drug selection, as described in the section Materials and Methods. To verify the shRNA targeting RIG-I, the cell lysates were subjected to western blotting with an anti-RIG-I antibody. The 110-kDa RIG-I band is indicated with an arrow, and the band intensity is shown below. (B) A549 cells were infected with IAV (MOI = 0, 0.001, 0.01, 0.1 from the left of  ) for 48 h, and the proliferation of IAV was analyzed with western blotting using an anti-HA antibody. The 65-kDa precursor IAV HA0 is indicated with arrows. Intensities of HA0 and HA2, and the HA2/HA0 ratio were shown below. (C) The indicated A549 cells (1 × 10⁵) in a 24-well plate were inoculated with IAV (MOI = 0.001). At 48 h post-infection, the viral spread was quantified as the release of infectious particles into the culture supernatants, as measured by a focus forming assay in MDCK cells. Data represent mean ± standard deviation of three experiments, *Significantly different at p < 0.05.

