Figure 6.
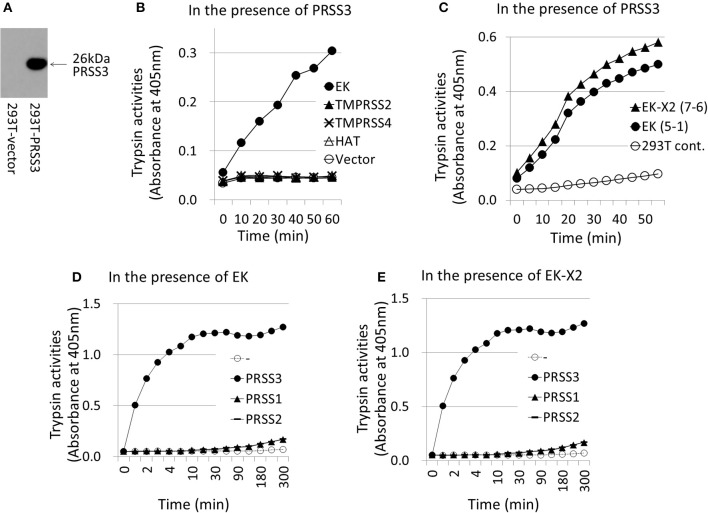
Activation of trypsinogen PRSS3 by TMPRSSs. The activation of trypsinogen PRSS3 by TMPRSSs was measured in vitro by incubating PRSS3-expressing cell lysates with a specific substrate and cell lysates expressing the indicated TMPRSSs. (A) 293T cells transfected with a PRSS3-expressing plasmid or vector alone were lysed at 48 h post-transfection, electrophoresed, and then western blotted with an anti-PRSS3 antibody. The 26-kDa PRSS3 band is indicated with arrow. (B) The PRSS3-expressing 293T cell lysate was mixed with 293T cell lysate transiently expressing one of the indicated TMPRSS proteases (EK, TMPRSS2, TMPRSS4, HAT, or vector only) for the indicated periods. The amount of pNA released from the specific substrate in the mixture was measured at 405 nm as the trypsinogen-activating function (trypsin activity). (C) Lysates prepared from 293T cells stably expressing EK (clone #5-1), EK-X2 (clone #7-6), or vector alone (293T-cont.), shown in Figure 5, were incubated with PRSS3-epressing 293T cell lysate, and the trypsinogen-activating function was measured. (D,E) 293T cell lysates expressing EK (D) or EK-X2 (E) were mixed with 293T cell lysates transiently expressing one of the indicated trypsinogens (PRSS1, PRSS2, PRSS3, or vector only) for the indicated periods. The amount of pNA released from the specific substrate in the mixture was measured at 405 nm as the trypsinogen-activating function (trypsin activity).

