FIGURE 3.
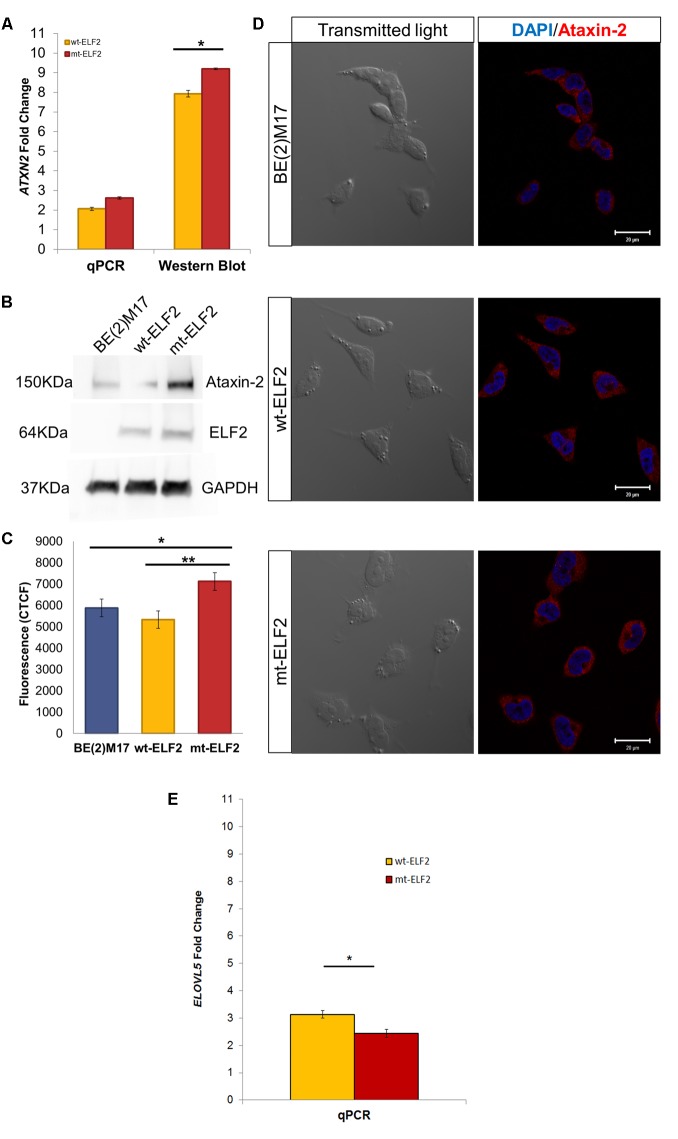
ATXN2 expression in BE(2)M17, wt-ELF2 and mt-ELF2 transduced cells. (A) ATXN2 qPCR and ataxin-2 Western blot show statistical differences between wt-ELF2 and mt-ELF2 transduced cells, both in qPCR and Western blot. (B) Representative western blot of BE(2)M17 exhibiting an increased content of ATXN2 in mt-ELF2 transduced cells. ATXN2 (#611378, 1:1000), Elf2 (#HPA006057-100UL, 1:1000), GAPDH (#AB2302, 1:3000 and secondary antibodies #HAF007, 1:6000, #HAF008, 1:3000, #A9046-1ML, 1:10000. (C) CTCF emitted by BE(2)M17 cells labeled with anti-ataxin-2 antibody in non-transduced, wt-ELF2 transduced and mt-ELF2 cells. (D) Representative immunocytochemistry image of ataxin-2 in non-transduced BE(2)M17, wt-ELF2, and mt-ELF2 transduced cells showing an increased staining in mt-ELF2 cell-line. ∗p < 0.02, ∗∗p < 0.002. Primary antibodies anti-ataxin-2 (1:250) and anti-ELF2 (1:500) and visualized with Alexa-555-conjugated goat anti-mouse #A-21422, 1:500 and Alexa-633-conjugated goat anti-rabbit #A-21071, 1:500, respectively. (E) ELOVL5 qPCR show statistical differences between wt-ELF2 and mt-ELF2 transduced cells. ∗p < 0.003.

