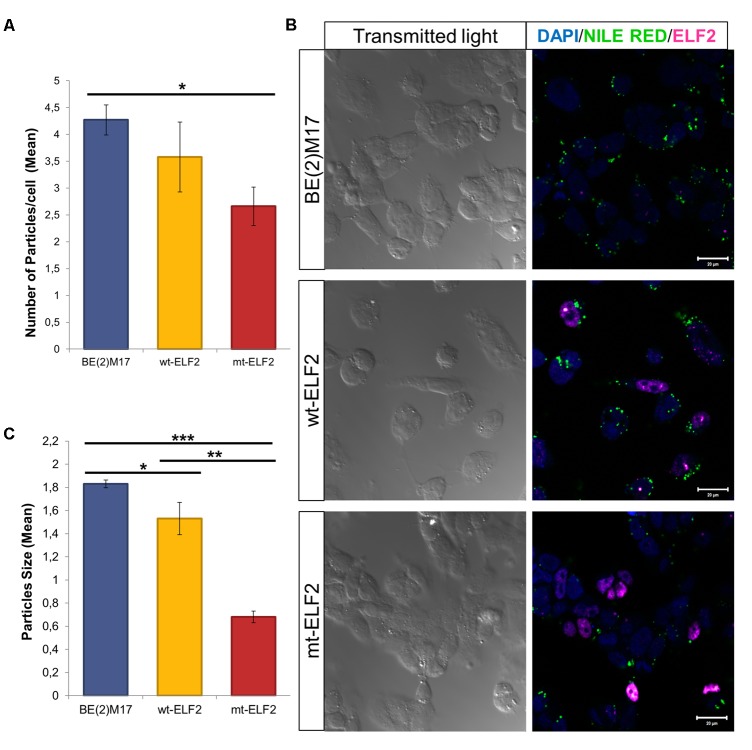
FIGURE 4.
Changes in Lipid droplets in transduced BE(2)M17 cell-lines. (A) Number of lipid droplets particles per cell in each cell-line (∗p = 0.02). (B) Representative immunocytochemistry image of Lipid droplets stained with Nile Red in non-transduced BE(2)M17, wt-ELF2 and mt-ELF2 transduced cells showing a decrease number and size of the droplets in mt-ELF2 cell-line. For lipid droplets experiments, cells were stained with Nile red to measure the number and size of lipid droplets. After Nile red staining, cells were fixed and staining with anti-ELF2 (1:500) and visualized with Alexa-633-conjugated goat anti-rabbit (1:500). (C) Mean of particles size in every cell-line. BE(2)M17 non-transduced cells vs. wt-ELF2 cells (∗p = 0.03); wt-ELF2 vs. mt-ELF2 transduced cells (∗∗p = 1.54 × 10⁻⁸); BE(2)M17 vs. mt-ELF2 (∗∗∗p = 1.55× 10-48).

