
Figure 1.
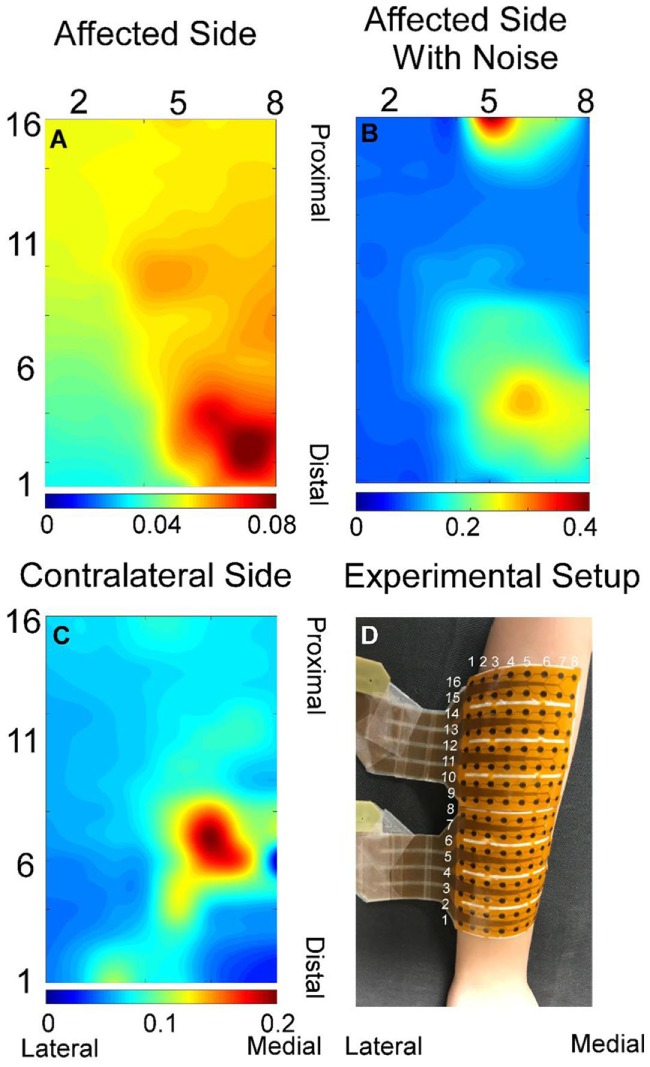
Exemplar root-mean-square map for index finger from both affected (A) and contralateral sides (C). (B) Root-mean-square map of panel (A) with background noise and motion artifact without filtering. (D) Experiment electrode placement. All root-mean-square maps were calculated from the trapezoid 50% contraction. All the X and Y axis labels indicate the row or column number of the electrodes.