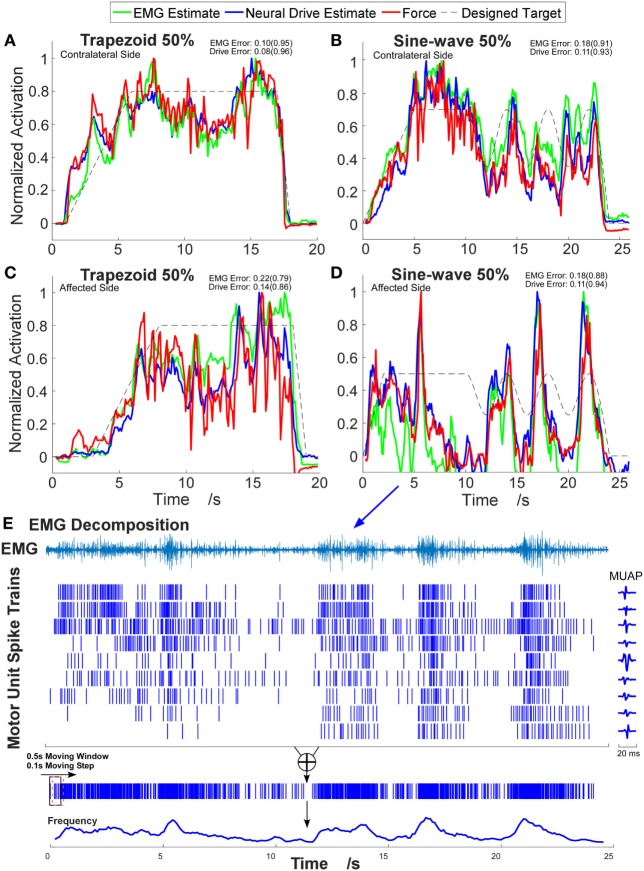
Figure 2.
Example time-series plots of four different contraction tasks. (A,B) Contralateral side. (C,D) Affected side. The corresponding root-mean-square errors (RMSEs) are presented and the correlation coefficients are shown in brackets. (E) Illustration of the decomposition results and the neural-drive-based estimation from trial (D). One channel electromyogram (EMG) signal with highest root-mean-square value is shown, and the corresponding waveforms of motor unit action potentials (MUAPs) in that channel are plotted.

