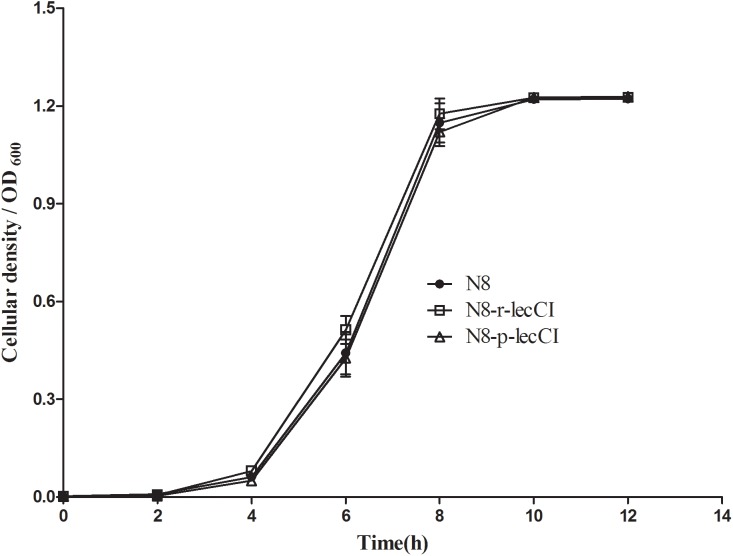
FIGURE 3.
Growth profiles of N8, N8-p-lecCI and N8-r-lecCI in SMG17 (non-selective pressure). The cellular density of the cultures was monitored once every 2 h by measuring OD600 for 12 h. All growth curve experiments were carried out in triplicate, and each point represents the average of separate experiments with standard deviation indicated by vertical bars. The difference between two groups was compared by t-test, the growth profiles of different strains exhibited no significant difference.

