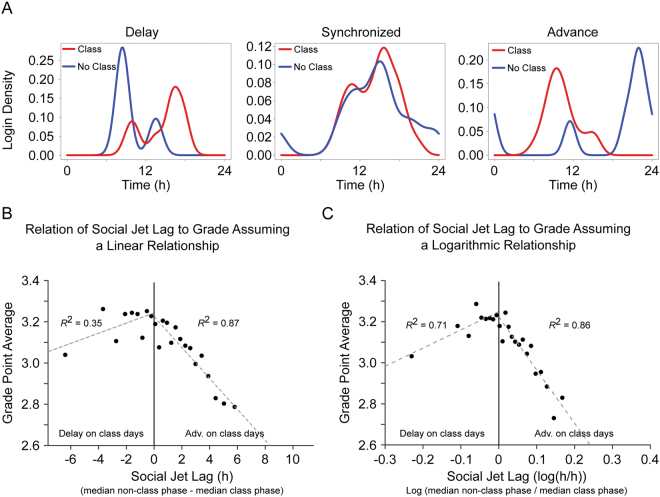
Figure 3.
Social jet lag correlated with decreased academic performance for both advances and delays. Some students delayed from average non-class days (blue) to average class days (red) (A, left), some changed phase less than half an hour, on average, between non-class and class days (A, center), and some students advanced from average non-class days to average class days (A, right) (hourly histograms from example individuals shown for each condition). If SJL is calculated by linear subtraction (B), then amplitude of SJL showed a significant negative correlation with GPA for students who advanced on class days and a non-significant trend of correlation was apparent for students who delayed on class days. If SJL is calculated on a log scale (C), then amplitude of SJL showed a significant negative correlation with GPA for students who advanced on class days, and for students who delayed on class days (for both B and C, 24 groups are used, so that if SJL were random, 1 group would appear per hour of potential SJL).

