Fig. 2.
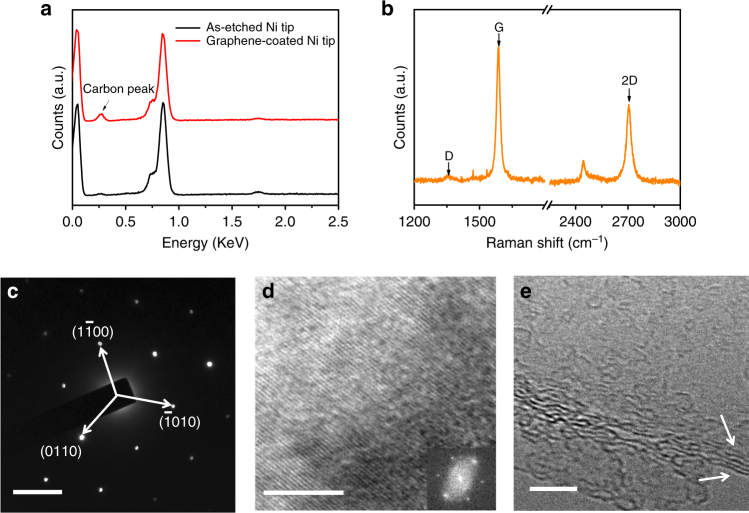
Characterization of the grown graphene. a EDS spectra of the Ni tip before (black) and after (red) graphene coating. b Typical Raman spectra obtained from the surface of Ni tip coated with graphene with a 532 nm excitation laser. c Hexagonal electron diffraction pattern of graphene surface. Scale bar, 5 nm−1. d High-resolution TEM image of the graphene surface showing the lattice fringes, and inset is the corresponding FFT pattern from the TEM image. e HRTEM image on the edge of the graphene flake. Scale bar, 5 nm (d, e)

