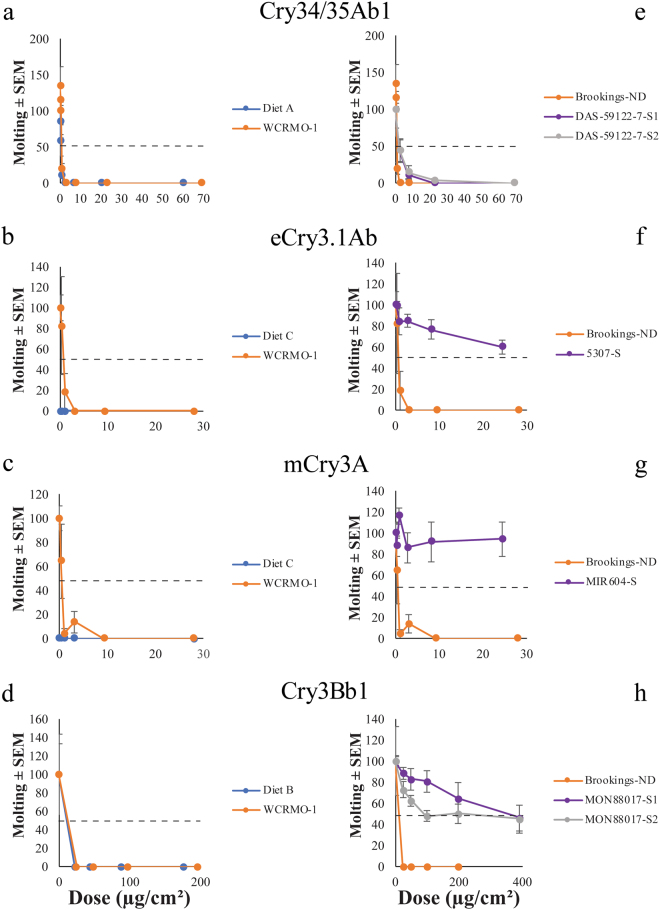
Figure 3.
Impact of Bt Protein on Molting. Molting of Brookings-ND (a–d) with exposure to Bt proteins on proprietary and WCRMO-1 diets, and molting of Brookings-ND and selected colonies (e–h) with exposure to Bt proteins on the WCRMO-1 diet. First, the molting rate on the buffer was calculated by dividing the number of larvae which molted by the initial number of larvae. This established a baseline response of the insect to the diet and buffer. All values for each colony, including the buffer dose (Dose 1) for the same colony, were then divided by the buffer dose value to establish relationships relative to the buffer dose. Each of the resulting values were then multiplied by 100. Bars represent the standard error of the mean (SEM).

