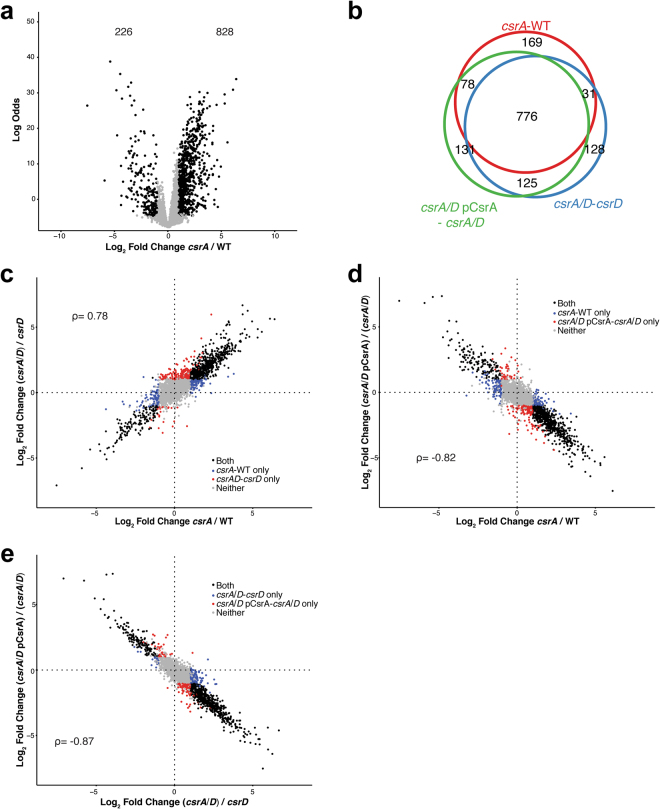
Figure 3.
CsrA retains its global role in regulating mRNA levels in the absence of CsrD. (a) Volcano plot depicting the log2 transformed fold change of RNA levels between the csrA mutant and its isogenic WT strain versus log odds of significance. Genes with significant changes shown in black. The number of genes up- and down-regulated in this comparison are shown at the top of the plot. (b) Venn diagram depicting the overlap of genes differentially expressed among the following comparisons: csrA - WT, csrA/D - csrD, and csrA/D pCsrA - csrAD. (c–e) The log2 transformed fold change in RNA abundance caused by mutation or overexpression of csrA in the WT or csrD mutant backgrounds. Blue and red dots represent the genes that are only differentially expressed in one strain background. Black and grey dots represent the genes that are differentially expressed in both of the backgrounds or neither, respectively. The associated Spearman’s correlation coefficients (ρ) are shown.

