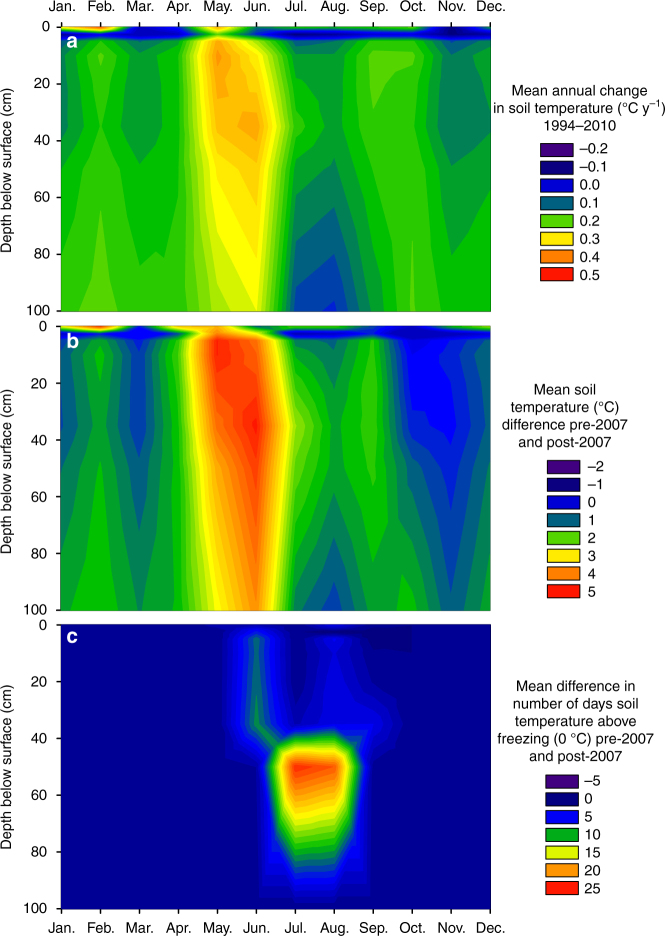
Fig. 2.
Changes in air and soil temperatures in the Lake Hazen watershed. a Mean annual change in monthly soil temperature (°C y−1) for the period 1994–2010. b Difference in mean monthly soil temperature (°C) between the periods of 2007–2010 and 1994–2006, indicating that soil temperatures have primarily increased since 2007. c Increase in the number of days mean daily soil temperature was above freezing during 2007–2010 compared with the 1994–2006 baseline, showing a recent thickening of the soil active layer. Depth 0 is shielded air temperature at 1 m above the soil surface

