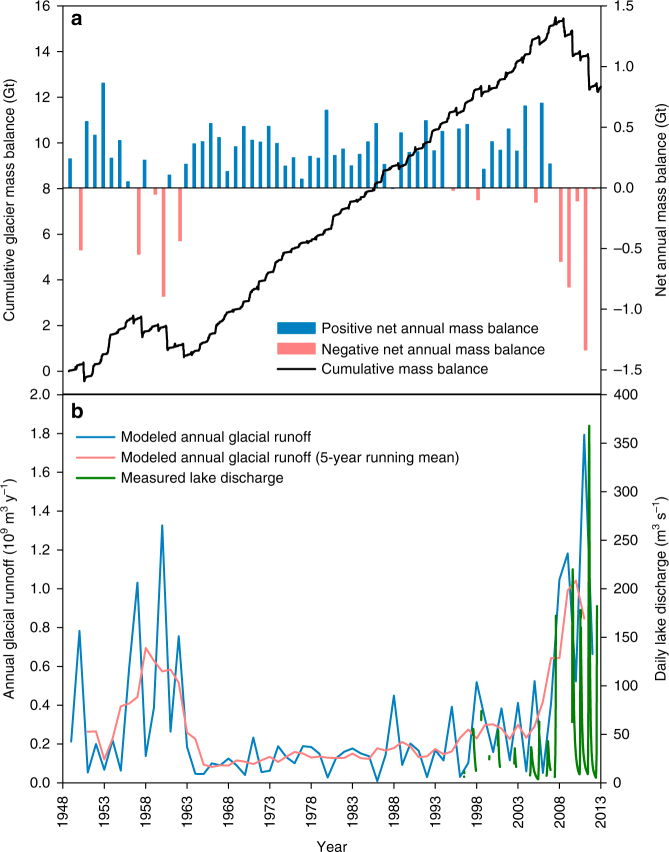
Fig. 4.
Changes in glacier mass balance, glacial runoff and Lake Hazen discharge. a Modeled net annual mass balance (bars) and cumulative mass balance (line) for glaciers in the Lake Hazen watershed for 1948–2012. All values are in Gt, but note that the annual and cumulative mass balances are plotted on different y-axis scales. b Modeled glacial runoff (annual and 5-year running mean, 1948–2012) compared with measured daily discharge from Lake Hazen at the outflow (Ruggles River) from 1996 to 2012

