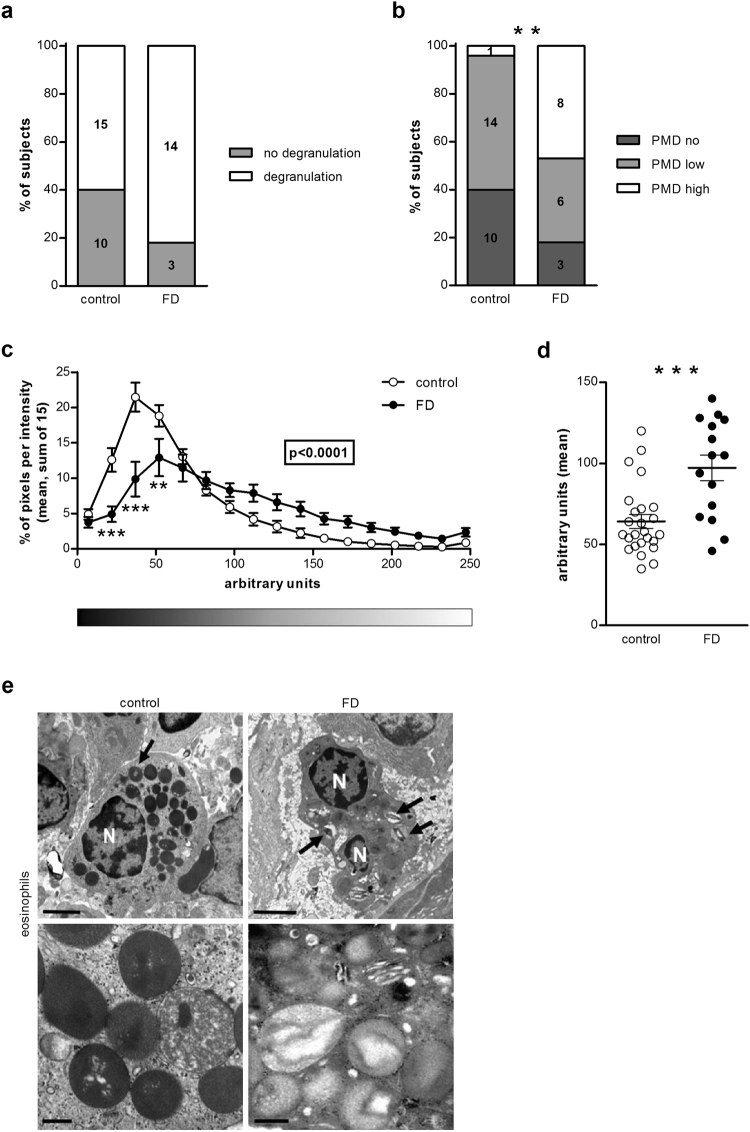
Figure 2.
Ultrastructural evaluation of mucosal eosinophils. Duodenal biopsy samples from healthy volunteers (control) and patients with FD were used to evaluate degranulation of eosinophils using transmission electron microscopy. Visual analysis of the presence (n = 25 for controls and n = 17 for patients with FD) (A) and degree (n = 15 for controls and n = 14 for patients with FD) (B) of degranulation in eosinophils. Quantitative analysis of eosinophilic granular density evaluated as the pixel intensity distribution (C) and the mean intensity per granule (D) (n = 25 for controls and n = 15 for patients with FD). (E) Representative transmission electron micrographs of eosinophils in mucosal biopsy specimens obtained from a control (left) and a patient with FD (right). Lower panels show representative cytoplasmic granules from each group. Note higher loss of granular content in granules from FD group (arrows). Bars indicate magnification (top panels: 2 µm; low panels: 0.5 µm) **p < 0.01, ***p < 0.001. FD, functional dyspepsia; N, nuclei; PMD, piecemeal degranulation.

