Fig. 5.
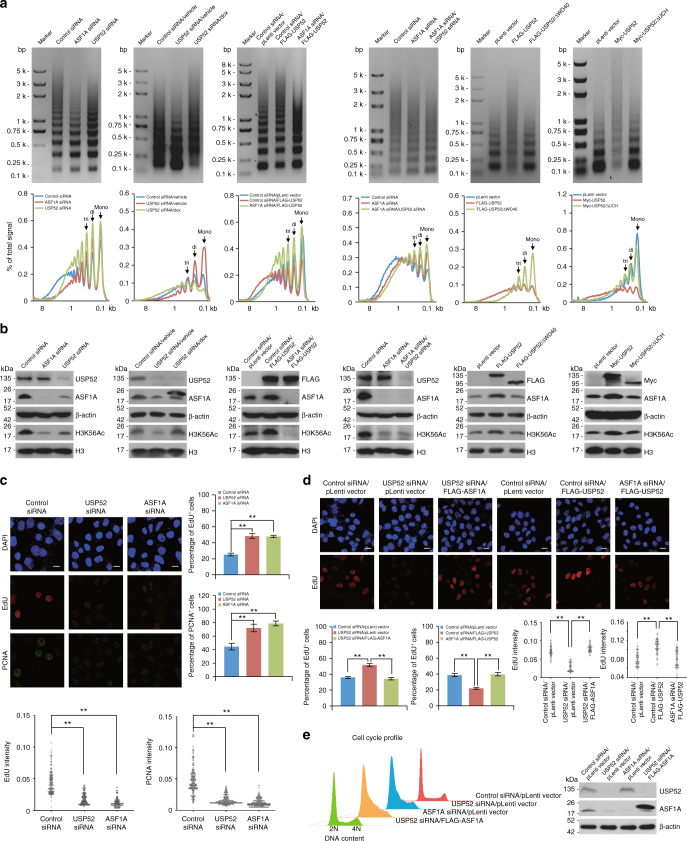
USP52 promotes chromatin assembly through stabilizing ASF1A. a MNase digestion assay. Control HeLa cells or HeLa cells stably expressing the indicated genes were transfected with the indicated siRNAs and synchronized by nocodazole followed by drug removal and FACS analysis at 2 h interval. Cell cycle profiles after synchronization and release into specific cell cycle stages are shown in Supplementary Fig. 5a. The same amounts of isolated nuclei from S-phase cells were treated with MNase (0.4 gel Unit/μl) and purified DNAs were resolved in 1.5% agarose gels followed by EtBr staining. The MNase digestion patterns were quantified by densitometry and the positions of mono-, di-, and tri-nucleosomal DNA fragment are indicated. In panel 2, cells with Dox-inducible expression of ASF1A were transfected with control siRNA or USP52 siRNA in the presence or absence of doxycycline. b Cellular lysates from cells in a were analyzed by western blotting with antibodies against the indicated proteins. c Immunofluorescence analysis of HeLa cells transfected with control siRNA, USP52 siRNA, or ASF1A siRNA followed by EdU pulse labeling. PCNA staining served as a marker for S-phase cells. Scale bar, 10 μm. Percentage of EdU or PCNA-positive cells with both strong and weak stainings was counted. Each bar represents the mean ± S.D. for biological triplicate experiments. The distribution of EdU or PCNA intensities from more than 200 cells is presented as dot plotting. **P < 0.01, one-way ANOVA. d HeLa cells stably expressing FLAG-ASF1A or FLAG-USP52 were transfected with control siRNA, USP52 siRNA, or ASF1A siRNA as indicated and analyzed by immunofluorescence after EdU pulse labeling. Scale bar, 10 μm. Percentage of EdU-positive cells with both strong and weak stainings was counted. Each bar represents the mean ± S.D. for biological triplicate experiments. The distribution of EdU intensities from almost 200 cells is presented as dot plotting. **P < 0.01, one-way ANOVA. e Control cells or HeLa cells stably expressing FLAG-ASF1A were transfected with indicated siRNAs and cell cycle profiles were analyzed by FACS. Cellular lysates from these cells were analyzed by western blotting with antibodies against the indicated proteins

