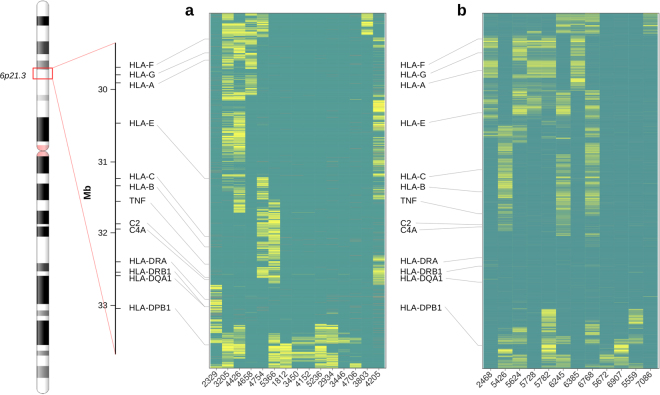
Figure 1.
Genotype comparison map showing haematopoietic stem cell transplantation (HSCT) donor-recipient pairs with large genomic fragments of mismatched single nucleotide polymorphisms (SNPs) in the major histocompatibility complex (MHC) segment. The mismatched HSCT pairs are shown in discovery order on the X-axis. Green depicts matched SNPs, yellow depicts mismatched and red indicates missing results or poor quality SNPs. Physical map of the MHC region with selected marker genes is shown on the left. The vertical axes in the similarity plot show the positions of SNP having a mismatch in at least one pair. (a) Identical-by-state status of 5137 SNPs covering the entire MHC gene complex by an Immunochip array in 15 HSCT sibling pairs (study cohort 1). The Y-axis shows a segment of chromosome 6p21 encompassing positions 29,002,062 bp (telomeric to HLA-F) to 33,496,714 bp (centromeric to HLA-DPB1). (b) Identical-by-state status of 12 HSCT pairs sequenced for the 4.5 Mbp MHC region (study cohort 2). The Y-axis shows a segment of chromosome 6p21 encompassing positions 29,000,825 bp (telomeric to HLA-F) to 33,477,140 bp (centromeric to HLA-DPB1).

