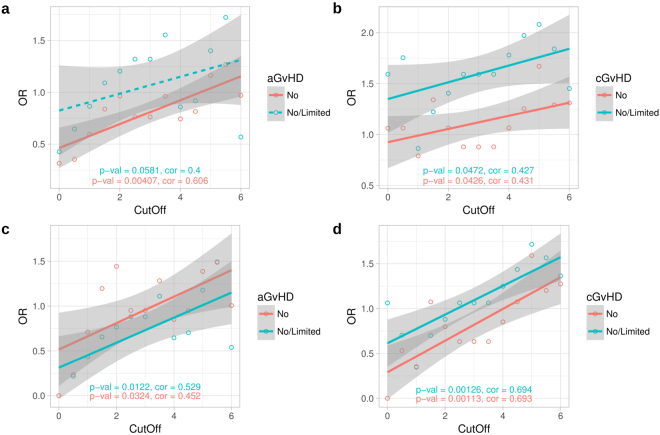
Figure 3.
Trend toward higher risk for graft-versus-host disease (GvHD) along increasing number of nucleotide mismatches between haematopoietic stem cell transplantation (HSCT) donor-recipient pairs in study cohort 1. The donor-recipient pairs are divided into low and high mismatch groups according to the total number of MHC region genotype differences between each pair. Similarly, each pair is also assigned into either aGvHD positive or negative group according to the recipient’s clinical GvHD gradus. The mismatch and GvHD categorized data are then arranged into a contingency table to calculate the odds ratio (OR). The mismatch threshold value, defined as the natural logarithm of the number of total SNP genotype differences per each HSCT sibling pair, is varied from 0 to 6 and the corresponding odds ratio is calculated for each threshold value. Thus, each data point represents an odds ratio at a particular threshold value. Moreover, two alternate definitions for the GvHD negative status are used: grade 0 (no) or grades 0–2 (no/limited) in acute GvHD, and no GvHD or no/limited in the chronic GvHD. The plots show the odds ratios (y-axis) against the varying mismatch threshold values (x-axis). (a) Acute (n = 91) and (b) chronic (n = 62) GvHD for cohort 1, and (c) acute (n = 85) and (d) chronic (n = 56) GvHD for fully HLA A-B-DRB1 matched cohort 1 pairs. Pairs with zero MHC mismatches are omitted. Linear regression lines are shown for both GvHD negative groups by their corresponding colours. Correlation is calculated by Kendall’s rank correlation. aGvHD, acute graft-versus-host disease; cGvHD chronic graft-versus-host disease; OR, odds ratio.

