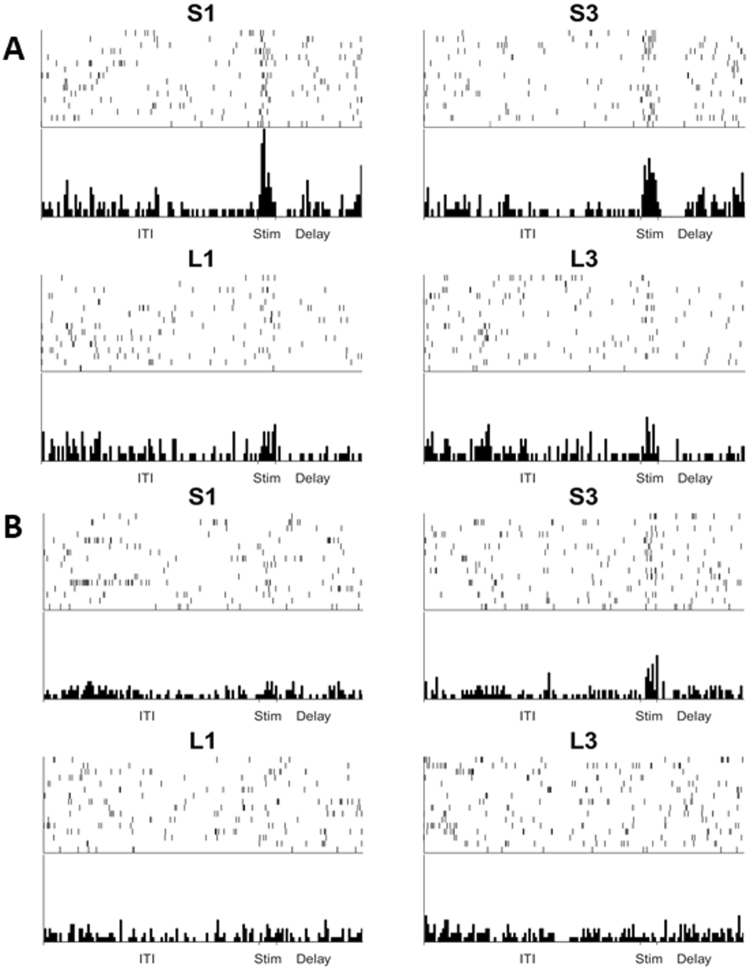
Figure 4.
Examples of NCL cell activity. Panel A and B show two different cells, each from different birds. Both panels present the raster and histogram of one cell over 64 trials. Panel A shows a cell that exhibits an increased firing rate at the time that the stimulus is presented for all four stimuli, however there is a noticeably increased response to S3 and S1 compared to L3 and L1. Panel B shows a cell that only exhibits an increase in firing on the presentation of the S3 stimulus, with no change in firing seen when the other stimuli were presented.

