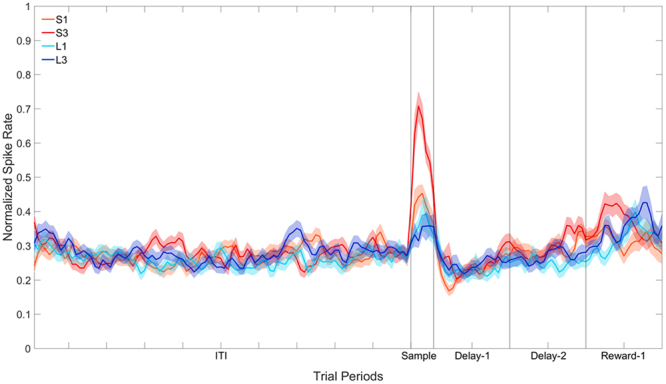
Figure 5.

Population plot: Sample filtering (peck aligned). Normalised firing rate for cells that show a significant effect of Stimulus across the four trial types during the Sample period. The ITI represents the entire 5 s ITI period, Sample represents a 300 ms period from −400 ms to −100 ms prior to the first peck, and Delay-1 and Delay-2 represent the first second and second second of the 2 s (for S1 and S3) or 8 s (for L1 and L3) delay period. Reward-1 is the first second of reward presentation. In S1 and S3, therefore, Reward-1 occurs after the 2 s delay period, whereas in L1 and L3 Reward-1 occurs after the 8 s delay period.
