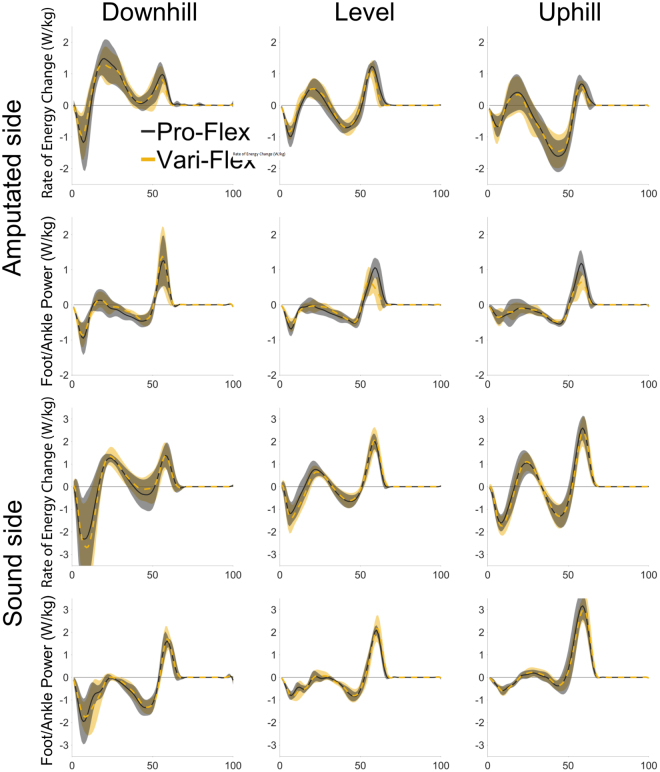
Figure 4.
CoM rate of energy change (rows 1 & 3) and foot/ankle power (rows 2 & 4) throughout the gait cycle for downhill (column 1), level (column 2), and uphill (column 3) for the amputated limb (rows 1 & 2) and the sound limb (rows 3 & 4). The Pro-Flex foot (solid black line) demonstrated higher peak powers than the Vari-Flex foot (dashed yellow line) and this resulted in a trend to reduce the absorption of energy by the sound limb during the step-to-step transition.

