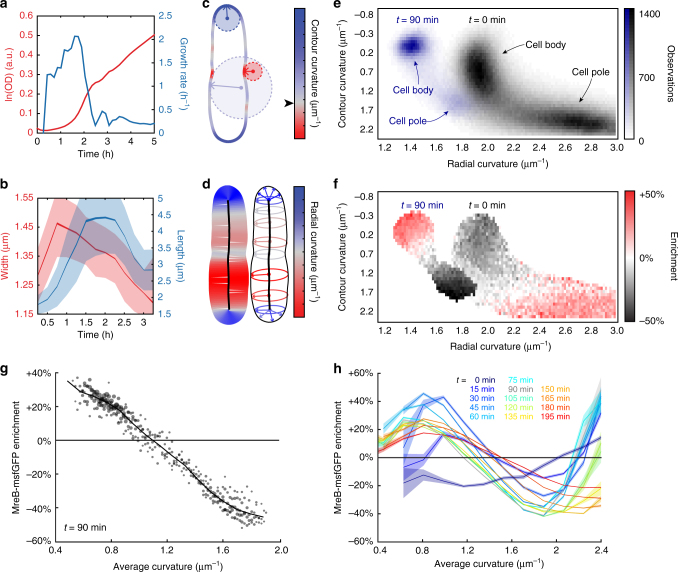
Fig. 1.
Cell shape and MreB localization patterns change as cell density increases in a growing culture. a The population density and growth rate of E. coli cells growing in fresh LB were estimated from optical density (OD) measurements. b Mean cell width and length across the population varied rapidly and asynchronously during the time course. Shaded areas represent standard deviation at each time point, whereas the variable thickness of the solid line represents the standard error at each time point (n > 800 cells). c, d The local geometry of every point on each cell’s contour was characterized by the in-plane contour curvature (c) and perpendicular radial curvature (d). c The red circle represents a point of negative contour curvature at the division site, the small blue circle represents a point of highly positive contour curvature at the pole, and the large blue circle represents a region of slightly positive contour curvature along the lateral wall. The black arrowhead next to the colormap in c demarcates zero contour curvature, corresponding to flat regions. d The radial curvature is inversely related to the local width of the cell. e The frequency of pairs of contour and radial curvature values sampled by a population of E. coli cells after 0 min and 90 min of growth illustrates the range of curvature values across their surfaces. Each bin is 0.0821 μm−1 (contour curvature) by 0.0165 μm−1 (radial curvature). Black: t = 0, blue: t = 90 min. f Enrichment of MreB fluorescence at t = 90 min observed for each bin in e with more than 50 observations demonstrates that MreB localization depends on both contour curvature and radial curvature. g Each circle represents the MreB-msfGFP enrichment for the estimated average curvature of a bin in f (corresponding to data from t = 90 min), which was defined as the average of contour and radial curvatures for that bin. The radius of each circle is linear with the log number of observations for the respective bin in e. The weighted average across bins with a given average curvature is shown as a solid line. h The enrichment of MreB-msfGFP varied substantially across the growth curve. Shaded areas represent the standard deviation of enrichment from resampled data at each time point (Methods section). All bins include at least 50 observations

