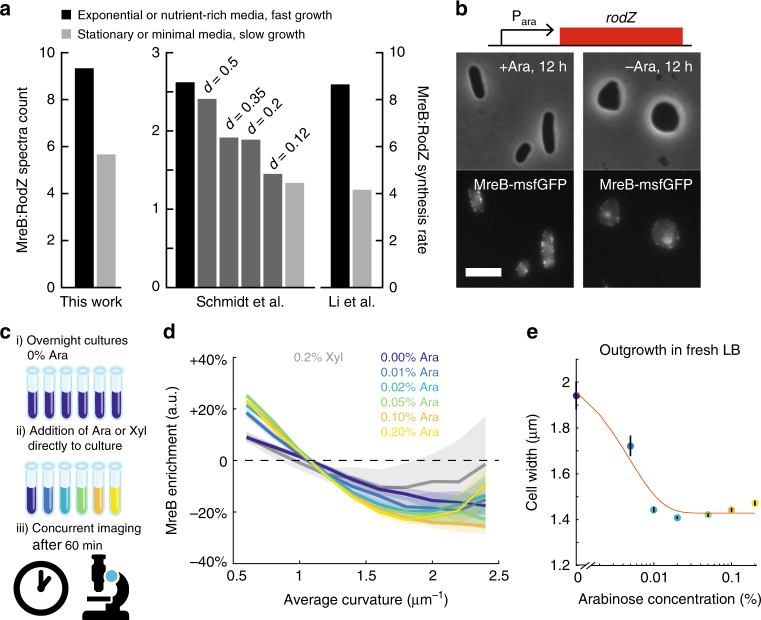
Fig. 2.
RodZ expression drives changes in MreB curvature enrichment profile. a The ratio of MreB to RodZ protein abundance consistently increases in a manner concordant with growth rate across multiple independent studies. d: chemostat dilution rate. b For a strain in which the native promoter of rodZ was replaced by Para, RodZ expression is driven by arabinose (Ara). In the absence of arabinose, cells became spheroidal. Scale bar is 5 µm. c Schematic of experimental approach in d. Overnight cultures grown in the absence of arabinose were further incubated after adding varying amounts of arabinose. The distribution of MreB fluorescence was measured after 60 min. d After 1 h of growth, induction of RodZ by arabinose enhanced the depletion of MreB at high-average curvature in a dose-dependent manner. By contrast, the enrichment profile was more uniform after induction with 0.2% xylose (Xyl) or 0% arabinose. Shaded areas represent the standard deviation of enrichment from resampled data for each condition. All bins include at least 50 observations. e Overnight cultures grown in 0% arabinose and back-diluted 1:10,000 into fresh LB with varying levels of arabinose exhibited dose-dependent steady-state widths after 4 h of growth. Black lines represent standard error of mean (n > 50 cells)

