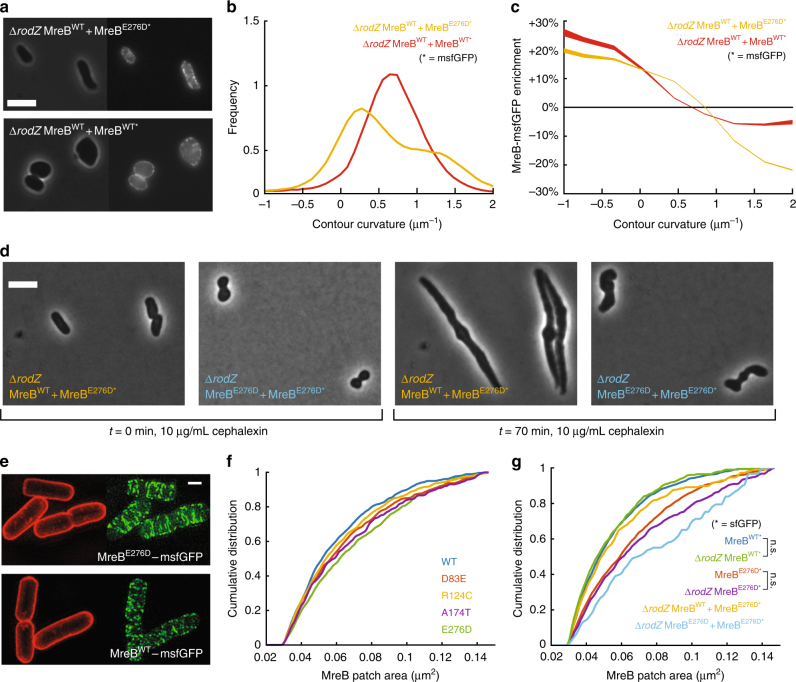
Fig. 5.
Concurrent expression of MreBE276D-msfGFP and MreBWT recovers rod shape in ∆rodZ cells. a Rod shape was rescued in ∆rodZ cells with chromosomal expression of MreBWT by introducing a plasmid-borne copy of MreBE276D-msfGFP (top), but not with a plasmid-borne copy of MreBWT-msfGFP (bottom). Scale bar is 5 µm. b ∆rodZ MreBWT + MreBE276D* cells exhibited a bimodal contour curvature distribution with one peak centered near zero, characteristic of rod-shaped cells, unlike the unimodal distribution of ∆rodZ MreBWT + MreBWT* cells. c ∆rodZ MreBWT + MreBE276D* cells exhibited enhanced depletion of MreBE276D-msfGFP at high-contour curvature as compared with MreBWT-msfGFP in ∆rodZ MreBWT + MreBWT* cells. The variable thickness of the solid line represents the standard error at each time point. d When division was inhibited by cephalexin (10 µg/mL), most (80%) ∆rodZ MreBWT + MreBE276D* cells maintained a rod-like shape after doubling in length, while only 50% of ∆rodZ MreBE276D + MreBE276D* cells elongated by twofold in 70 min . Snapshots of cells shown before (left) and after (right) 70 min of cephalexin treatment. Scale bar is 5 µm. e Structured illumination microscopy revealed that the MreBE276D-msfGFP mutant strain had qualitatively longer filaments than the strain harboring MreBWT-msfGFP. Red fluorescence represents FM 4-64FX membrane staining. Scale bar is 1 µm. f The cumulative distributions of MreB-msfGFP fluorescence patch sizes for ∆rodZ suppressor MreB mutants were intermediate between those of MreBWT and MreBE276D. Each MreB patch was defined as a continuous region larger than the diffraction limit with high-GFP signal located within the cell contour. n > 50 single cells were analyzed for each strain. g Patch sizes for varied widely across strains, as indicated by the cumulative distribution of MreB-msfGFP fluorescence. Strains containing MreBE276D-msfGFP consistently showed distributions indicative of larger patch sizes (p < 10−18, t-test). Deletion of RodZ alone did not lead to statistically significant differences in the distribution of MreB patch sizes. n > 50 single cells were analyzed for each strain

