Figure 2.
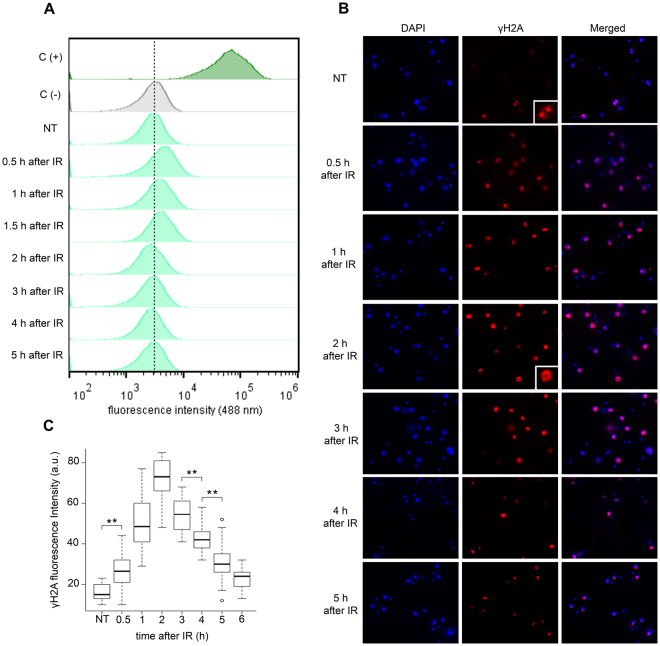
DNA fragmentation detection and H2A phosphorylation after IR. The parasites were treated with 50 Gy of IR and (A) the DNA fragmentation was measured using terminal deoxynucleotidyl transferase (TdT-TUNEL) after treatment. C(−) represents a negative control in which the TdT enzyme was not present. In C(+) the samples were pre-treated with DNase I generating therefore the maximum positive fluorescence intensity signal. Dotted line was used to indicate the peak that means negative fluorescence. Therefore, peak to the right of dotted line was considered positive. (B) The cells were analyzed by IIF to check the γH2A fluorescence intensity after IR treatment. (C) Box plots represent the measurement of the γH2A fluorescence intensity in the IIF assay. The data represent the average for 100 analyzed cells. Bars represent the standard deviation. (**) Indicate significant differences compared to the non-treated cells via a Friedman and Wilcoxon test.

