Figure 5.
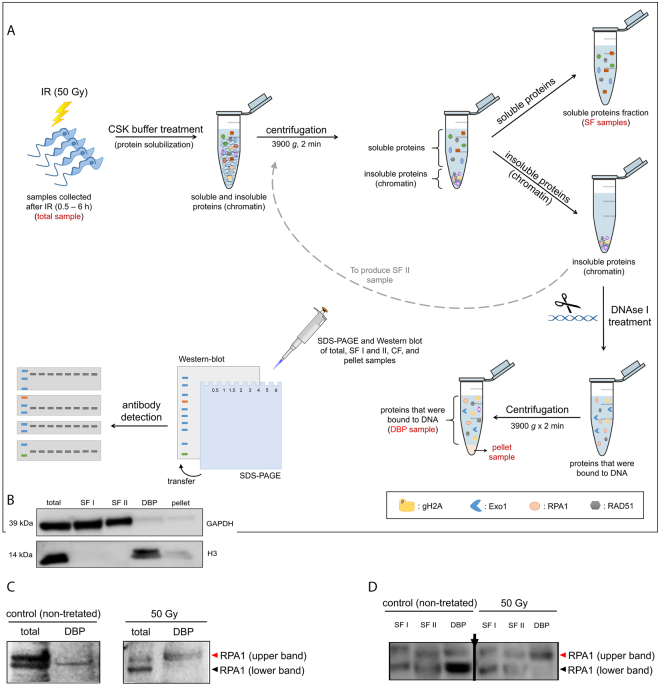
Fractionation assay and WB analysis of RPA1 bands after IR. (A) Scheme showing the primary steps of the fractionation assay. The names indicated in red represent the fractions used in WB analysis. (B) The GAPDH protein was used as an internal control for the soluble protein fraction (SFI and II). The H3 protein was used as an internal control for the DNA-bound protein fraction (DBP). Western blot membranes were cropped to avoid cross-reactions between secondary antibodies during the revealing process. (C and D) Molecular weight migration profile of RPA1 in total, soluble protein fraction (SFI and II) and DNA bound protein (DBP) extracts after IR treatment. Arrow in panel D indicates a region where a lane was excluded from the gel, but all samples were analyzed in an unique gel.

