Figure 6.
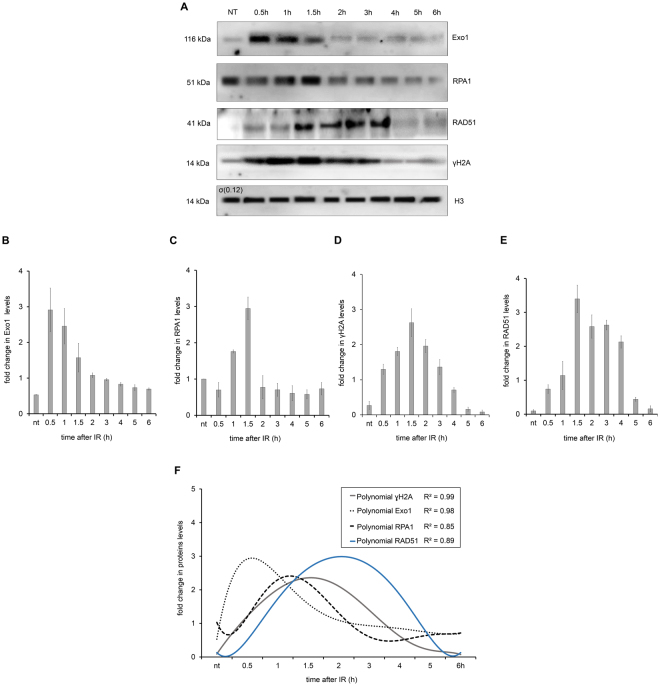
Recruitment of Homologous Recombination (HR) repair proteins to DNA after IR. (A) WB analysis of DNA-bound proteins (DBP) derived from the fractionation assay after IR treatment. The H3 protein was used as an internal control. (B) A WB quantification of the Exo1 relative intensity after IR treatment. (C) A WB quantification of the RPA1 relative intensity after IR treatment. (D) A WB quantification of the γH2A relative intensity after IR treatment. (E) WB quantification of the RAD51 relative intensity after IR treatment. The data represent the average of three independent experiments and the error bars represent the standard deviations. (F) A sixth-degree polynomial regression of the WB quantifications. Non-parametric estimation curves and R2 factors are presented. Notably, the Western blot membranes were cropped to avoid cross-reactions between secondary antibodies during the revealing process.

