Figure 7.
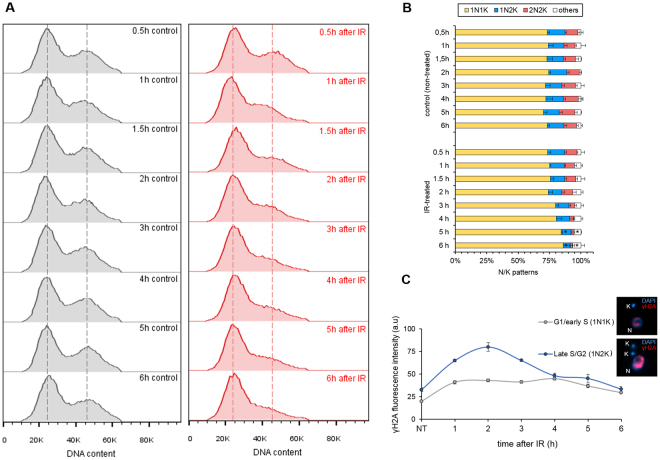
Effects of the IR response on the cell cycle. (A) DNA content analysis of PI-stained cells. The red histograms represent the IR-treated cells and the gray histograms represent the non-treated cells. This assay was performed in triplicate. Dotted lines represent the peak of fluorescence intensity of G1/S cells (left peak) and of G2/M cells (right peak). (B) A measurement of N/K patterns through the DAPI-staining of IR-treated and non-treated cells. The data represent the average of three independent experiments and the error bars represent the standard deviation. n > 100 for each sample. (C) Fluorescence intensity of γH2A, according to the cell cycle phases (G1/early S and late S/G2). Note that these cell cycle phases were estimated based on the duplication of the kinetoplast (K) and nucleus (N) during the cell cycle. The data represent the average of 50 analyzed cells from the G1/S phase and 15 analyzed cells from the late S/G2 phase.

