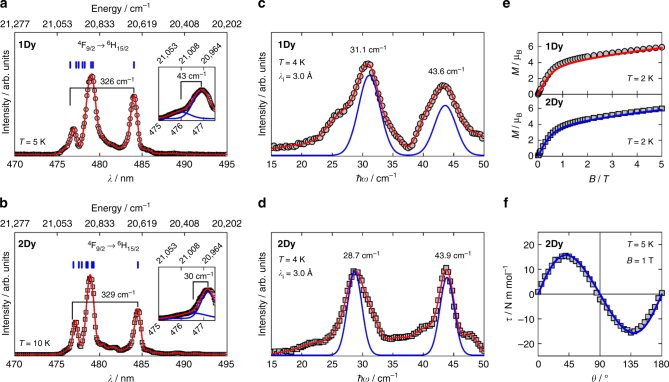
Fig. 3.
Crystal field quantification. Low-temperature luminescence spectra (4F9/2→6H15/2) for 1Dy (a, T = 5 K) and 2Dy (b, T = 10 K) recorded with excitation wavelengths of λex = 386 and 387 nm, respectively. For 1Dy (2Dy) the red line is a fit to a sum of 9 (11) Gaussians, and the vertical blue lines denote the positions of the Kramers doublets within the 6H15/2 ground multiplet. The insets give high-resolution spectra of the two peaks at highest energy, with best fits to a sum of two Gaussians. INS spectra (integrated over 0.95 Å−1 ≤ Q ≤ 1.8 Å−1) for 1Dy(c) and 2Dy (d) at T = 4 K recorded with an incident neutron wavelength of λi = 3.0 Å. For 1Dy (2Dy) the red line is a fit to a sum of 7 (8) Gaussians. The blue lines are the simulated INS spectra based on CF parameters in Table 1. In c and d, the errors are less than the size of the symbols. Powder-averaged molar magnetization for 1Dy (e, top) and 2Dy(e, bottom) at T = 2 K, with lines indicating the best fits. Molar magnetic torque of a single crystal of 2Dy (f) at T = 5 K recorded in an applied magnetic field of B = 1 T. θ denotes the angle (increasing anticlockwise) between the crystallographic ab plane and the applied magnetic field. The blue line represents the angular dependence of the magnetic torque simulated from the CF parameters for 2Dy given in Table 1

