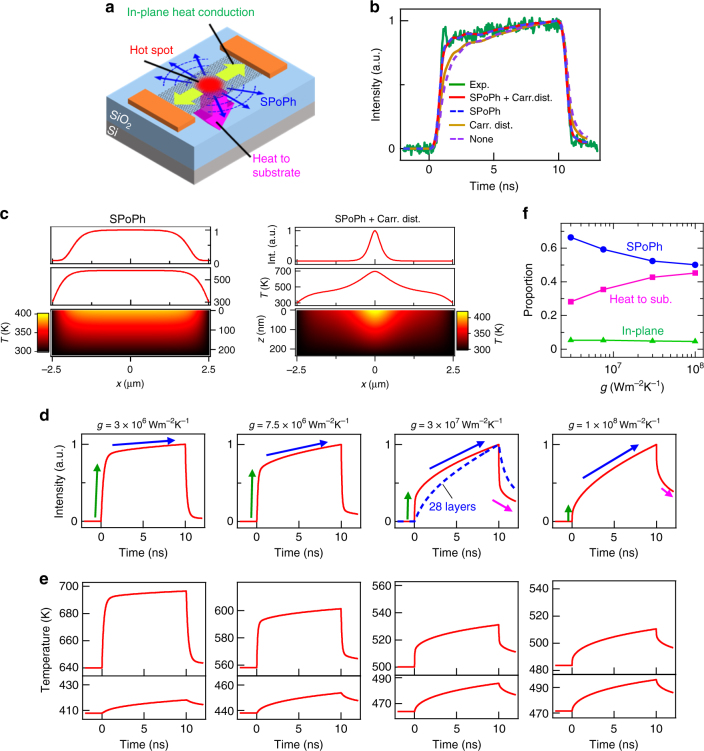
Fig. 3.
Theoretical calculations and mechanisms of high-speed emission. a Schematic picture of the thermal transport model in graphene device: heat dissipation to substrate, in-plane heat conduction, enhanced by a hot spot, and quantum remote heat transfer by SPoPh. b Numerically calculated time-resolved emission intensities for the model with/without the consideration of the spatial carrier distribution (with: red and brown, without: blue and purple broken curves) and the remote SPoPh scattering(with: red and blue, without: brown and purple curves) in comparison with the experimental result (green curve) in Fig. 2a under 10-ns-width rectangular input. c Top and middle: emission intensity and temperature distribution of graphene, respectively. Bottom: two-dimensional temperature distribution of a SiO2 substrate. Left and right results are for the model with and without the consideration of spatial carrier distribution, respectively. In this calculation, the graphene length and the SiO2 thickness are 5 μm and 230 nm, respectively. For the result with carrier distribution, a hot spot is generated at the Dirac point. d Emission intensity response simulated for the single-layer graphene emitter as a function of the thermal conductance g between graphene under ideal rectangular voltage (width: 10 ns, amplitude: 6–7 V). The emission intensity is calculated by the integral of Planck’s law over the wavelength region from 0.9 to 1.6 μm. Broken blue curve is the simulated result taking into account the number of layers (28 layers). Green, blue, and pink arrows correspond to the arrows in Fig. 2d. e Transient temperature of the center of graphene (top) and the uppermost SiO2 layer beneath the graphene (bottom) as a function of g under the same condition of (d). f Proportion of heat dissipation mechanisms (SPoPh, heat to a substrate and in-plane heat conduction) as a function of g

