
Figure 6.
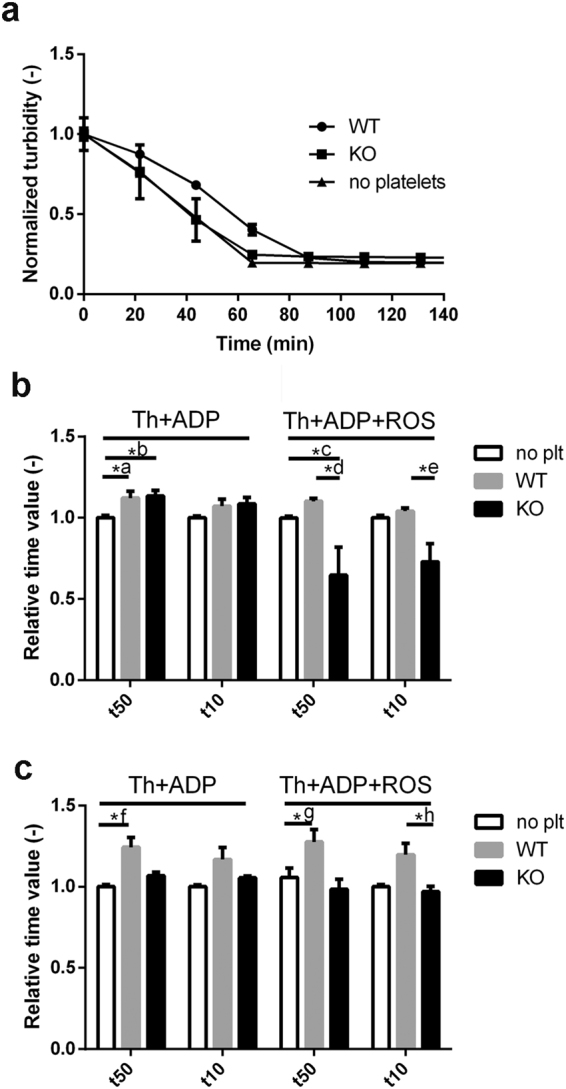
tPA-induced lysis of platelet-containing fibrin clots. Fibrinogen (6 µM) supplemented with 0.5 μM plasminogen, 2.5 mM CaCl2, 10 μM ADP and in the indicated cases, with murine platelets and modulator additives was clotted with 16 nM thrombin for 60 min. Lysis was initiated by addition of 50 µg/ml tPA to the clot surface and light absorbance at 340 nm was measured. (a) Representative lysis curves of tPA-induced lysis in clots containing ROS and platelets isolated from wild type (WT) and CypD−/− (KO) mice. The presented turbidity values are the measured absorbance values normalised for the maximal absorbance for each sample (n = 4, every 10th measurement point is shown, bars represent SE values). The time to reach 50% (t50) and 10% (t10) of the initial turbidity was calculated from the lysis curves of clots containing (b) 1 × 10⁵/µl or (c) 2 × 10⁵/µl platelets and presented in relative units: the mean value of the t50 and t10 for platelet-free fibrin (no plt) in each independent set of measurement was considered to be 1. Mean of n = 7–8 replicates and SE values are shown. Asterisks indicate significant differences at P < 0.05 according to the post-hoc Dunn test performed after Kruskal-Wallis test for the respective triplets of data. *a: P = 0.0241, *b: P = 0.0241, *c: P = 0.0154, *d: P = 0.0021, *e: P = 0.0034, *f: P = 0.0009 *g: P = 0.0184, *h: P = 0.0239.