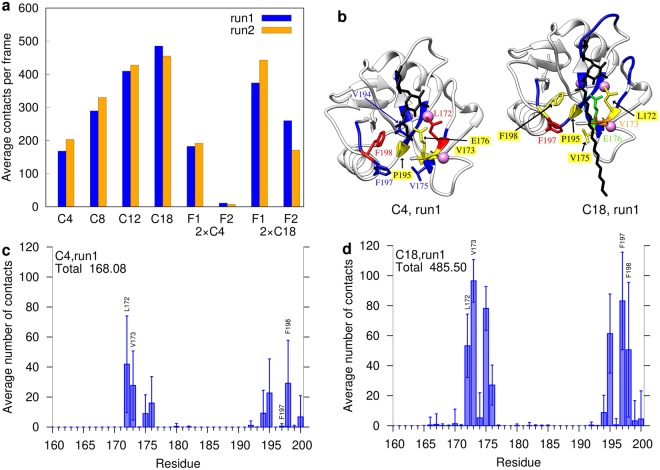
Figure 2.
Contacts between Mincle and the acyl chains. (a) Average number of contacts per system and acyl chain; (b) Initial structures of the C4 and C18 monoesters in complex with Mincle. Residues are colored according to their average number of contacts with the acyl chain: red > orange > yellow > green > blue. (c,d) Contacts per Mincle residue for (c) C4 and (d) C18 monoesters in run 1. For each Mincle residue, the average number of contacts (±standard deviation) to the acyl chains is plotted. Some bars representing key residues are directly labeled in the plot. The data for the remaining mono- and diesters of run1 and for run2 is shown in the Supplementary Figures S6–S9.

