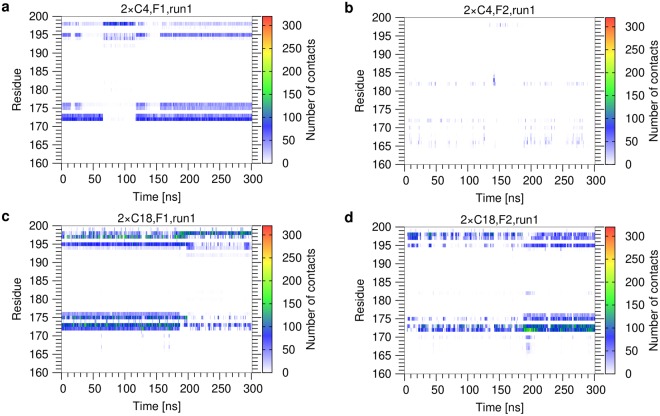
Figure 6.
Contacts per Mincle residue as a function of simulation time for diesters (run 1). (a) 2 × C4, F1 acyl chain; (b) 2 × C4, F2 acyl chain; (c) 2 × C18, F1 acyl chain; (d) 2 × C18, F2 acyl chain. Contacts were monitored for the individual residues of Mincle (shown on the y-axis) over the simulation time. The contact map is colored according to the number of contacts formed. The data for run2 is shown in Supplementary Figure S15.

