Fig. 1.
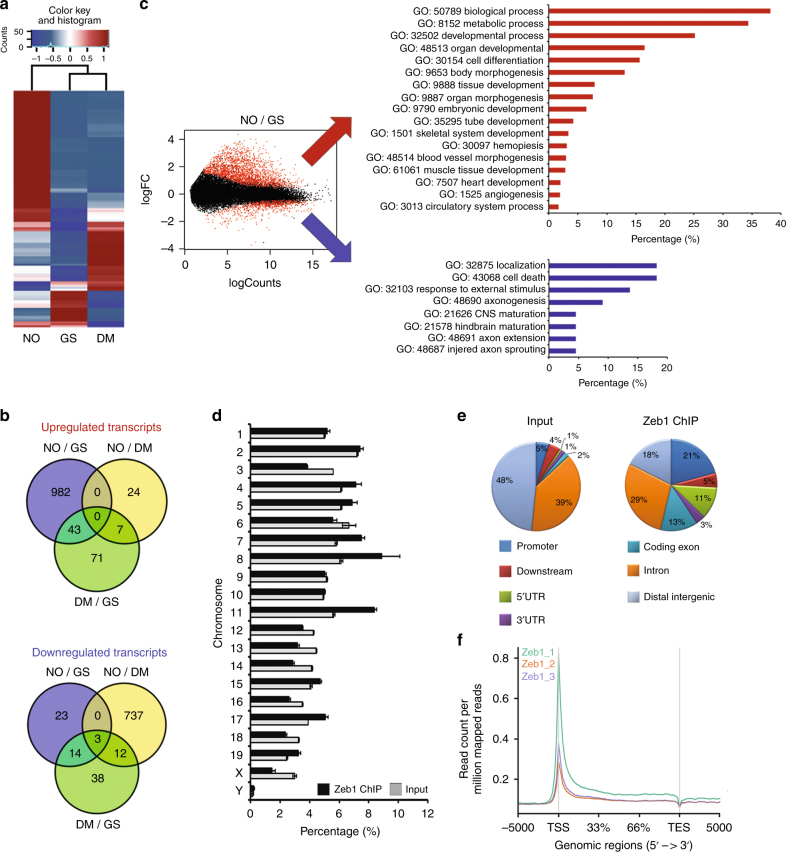
Identification of NO-responsive transcripts and Zeb1-associated genomic regions. a Heatmap showing the 50 most differentially regulated genes in mESC cultured for 24 h in GS, DM, or NO identified by total RNA sequencing analysis (n = 3 each group). Red and blue represent over- and under-expressed genes, respectively. b Venn diagrams depicting the distribution of upregulated (upper panel) and downregulated (lower panel) unique or common transcripts among GS, DM, or NO conditions. c Left panel: MA plot of differentially regulated genes expressed in mESC cultured for 24 h in NO compared to GS condition. Red dots show genes with a p adjusted value <0.05. Right panels: Gene ontology analysis of NO-differentially regulated transcripts between mESC cultured in GS and NO. Upregulated genes depicted in the upper panel, red bar graph; downregulated genes in the lower panel, blue bar graph. d Distribution of chromatin–associated Zeb1 regions over mouse chromosomes. Black bars: percentage of all chromatin/Zeb1-associated regions; gray bars: background derived from input samples (n = 3). e The pie chart illustrates the distribution of chromatin-associated Zeb1 regions (Zeb1-ChIP) over specific genomic features depicted as follows: (i) promoters encompassing 3000 bp upstream of the transcription start site (TSS) (blue sector); (ii) downstream regions encompassing 3000 bp from transcription end site (TES) (red sector); 5′ UTRs (green sector) and 3′ UTRs (purple sector) as well as coding exons (turquoise sector) and introns (orange sectors) relative to the gene bodies; iii) distal intergenic regions (light blue sectors). Input and Zeb1-ChIP represented in the left and right pie chart respectively. f Gene body profile depicting Zeb1-ChIP regions distribution in association with TSS or TES produced by ngsplot

