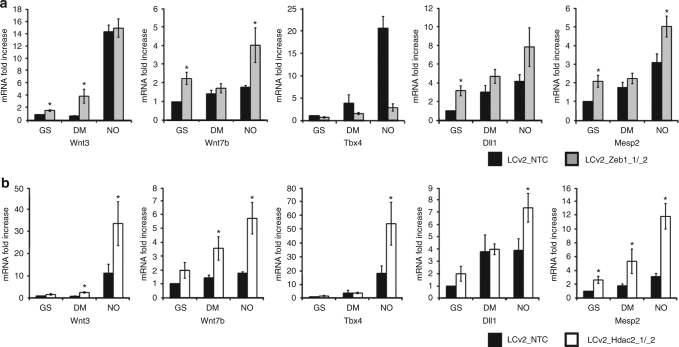
Fig. 4.
Evaluation of mesendodermal transcripts in mESC engineered by CRISPR-Cas9. a qRT-PCR analysis of mRNA expression relative to Wnt3, Wnt7b, Tbx4, Dll1, and Mesp2 transcripts in mESC cultured for 24 h in GS, DM, and NO prior (control vector LCv2_NTC; black bar) and after CRISPR/Cas9 inactivation of Zeb1 (LCv2_Zeb1_1/_2; gray bars). Data are shown as the mean of three independent experiments for each CRISPR/Cas9 vector ± s.e.m. represented as fold increase compared to control mESC after subtraction of the housekeeping gene p0 signal (*p < 0.05 LCv2_Zeb1_1/_2 vs. LCv2_NTC). b qRT-PCR analysis of mRNA expression relative to Wnt3, Wnt7b, Tbx4, Dll1, and Mesp2 transcripts in mESC cultured for 24 h in GS, DM, and NO prior (control vector LCv2_NTC; black bar) and after CRISPR/Cas9 inactivation of Hdac2 (LCv2_Hdac2_1/_2; white bars). Data are shown as the mean of three independent experiments for each CRISPR/Cas9 vector ± s.e.m. represented as fold increase compared to control mESC after subtraction of the housekeeping gene p0 signal (*p < 0.05 LCv2_Hdac2_1/_2 vs. LCv2_NTC). Data analyzed by Kolmogorov–Smirnov test

