Fig. 6.
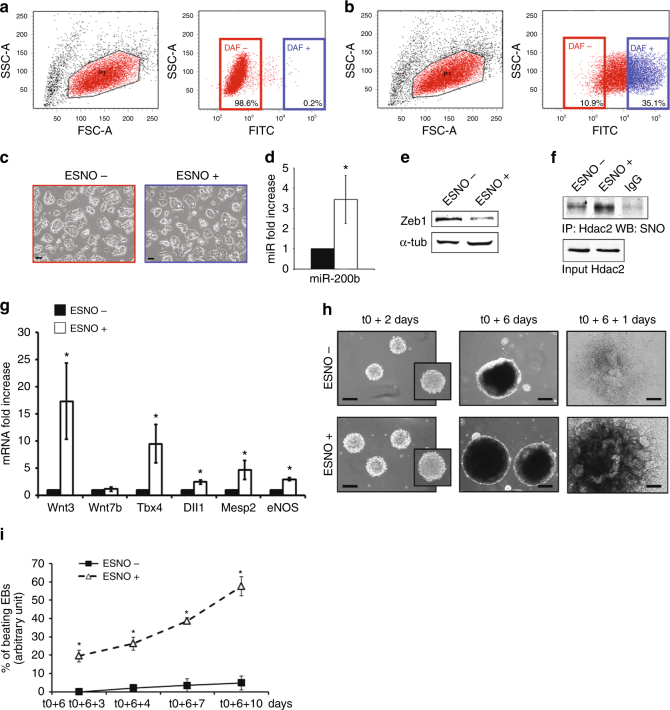
ESNO +/− subpopulation isolation and characterization. a, b FACS analysis. a Left: representative scatter plot showing forward (FSC-A) and side scatter (SSC-A) distribution in GS. Right: representative dot plot showing the fluorescein isothiocyanate (FITC) and SSC-A distribution in GS in the presence of DAF fluorescent probe. b Same as a related to 2 h DM. Each experiment: gating to separate ESNO+ (DAF+; blue dots) from ESNO− (DAF−; red dots) established manually (n = 3). c Representative phase contrast microscopy images of ESNO− (red upper panel) and ESNO+ (blue lower panel) cultured in DM. Scale bar 10 µm. d miR-200b expression analysis in ESNO+ (white bar) compared to ESNO− (black bar) at 24 h from sorting. Data shown as mean ± s.e.m. represented as fold increase compared to ESNO− after subtraction of the housekeeping gene p0 signal (*p < 0.05; n = 3). e Representative WB of Zeb1 in ESNO+ and ESNO− at 24 h from sorting (n = 3). Full-length blot provided in Supplementary Fig. 11a. f Representative IP/WB analysis of Hdac2 S-nitrosylation in ESNO+ and ESNO− after sorting (n = 3). Full-length blot provided in Supplementary Fig. 11b. g Wnt3, Wnt7b, Tbx4, Dll1, Mesp2, and eNOS expression analysis in ESNO+ (white bars) compared to ESNO− (black bars) at 24 h from sorting. Data shown as mean ± s.e.m. represented as fold increase compared to ESNO− after subtraction of the housekeeping gene p0 signal (*p < 0.05; n = 3). h Phase contrast microscopy images of ESNO− and ESNO+ derived EBs (upper and lower panels, respectively) taken at different stages of the EB formation process after sorting (t0): 2 and 6 days of hanging drop culture after t0 (t0 + 2 and t0 + 6, respectively) and the first day after plastic adherence following hanging drop culture (t0 + 6 + 1). Scale bar 30 µm. i Quantification of beating EBs generated by ESNO+ (open triangles) and ESNO− (closed squares) upon a time course from three (t0 + 6 + 3) to ten (t0 + 6 + 10) days after plastic adherence (t0 + 6). Data expressed as mean ± s.e.m. (average total number of plated EBs/condition/experiment = 48; *p < 0.05 ESNO+ vs. ESNO−; n = 4). Data analyzed by Kolmogorov-Smirnov test (d, g) and by 2 way ANOVA (i)

