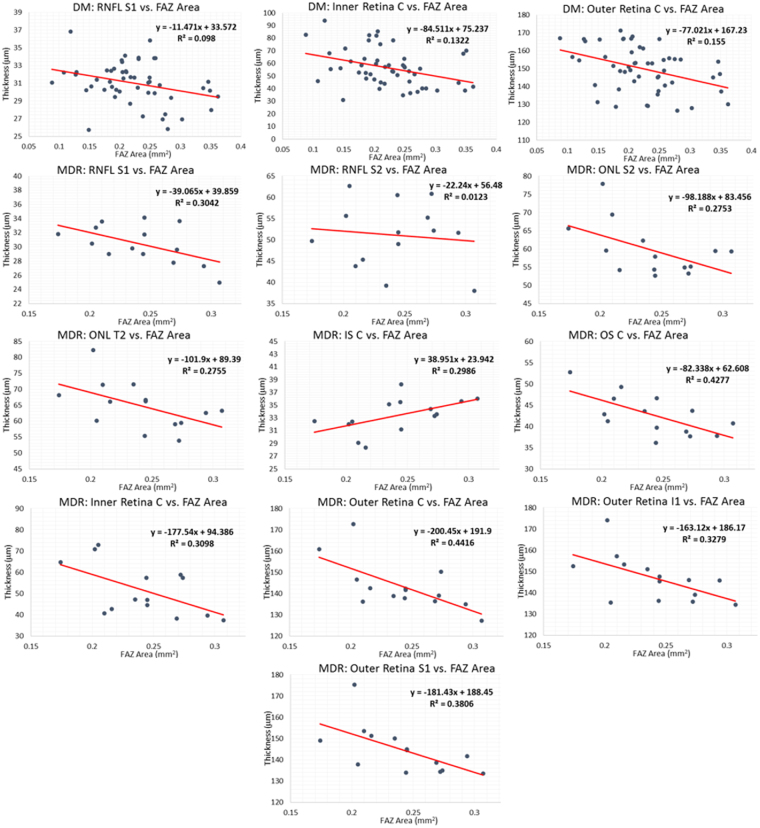
Figure 3.
Retinal layer thickness data vs. the FAZ area in the DM and MDR group. Each graph is labeled with the region and layer to which it corresponds. The red line represents the regression line, of which the equation is displayed in the graph region. In all cases, the “y” represents thickness in microns and the “x” represents FAZ area in mm2. The R2 is the coefficient of determination, which compares the ratio of the average difference of the data point and the line of best fit with that of the data point and the average “y” value. A negative slope corresponds to layer thinning as FAZ area increases, while a positive slope corresponds to layer thickening as FAZ area increases.

