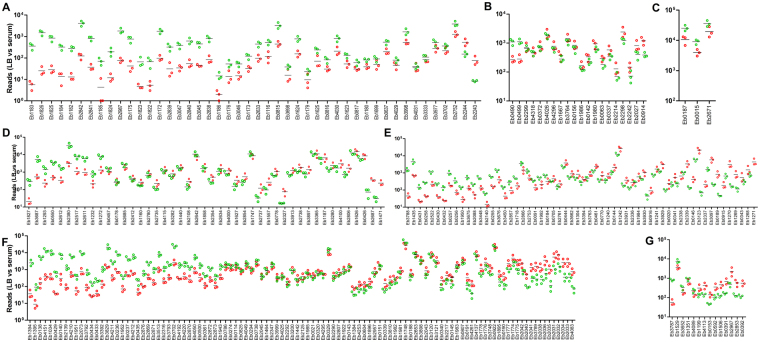
Figure 4.
Transcriptional profile of differentially regulated genes grouped according to their most likely functions in EB-247 adaptation to and survival in human serum. (A) Iron uptake, (B) regulatory function, (C) chaperons, (D) others, (E) transport and binding, (F) energy metabolism, and (G) membrane proteins. The circles represent the number of reads mapped for a single gene. Green color represents the reads obtained from the sample grown in serum, while red represents reads obtained from EB-247 grown in LB. The data shown is the result of three independent biological experiments.

