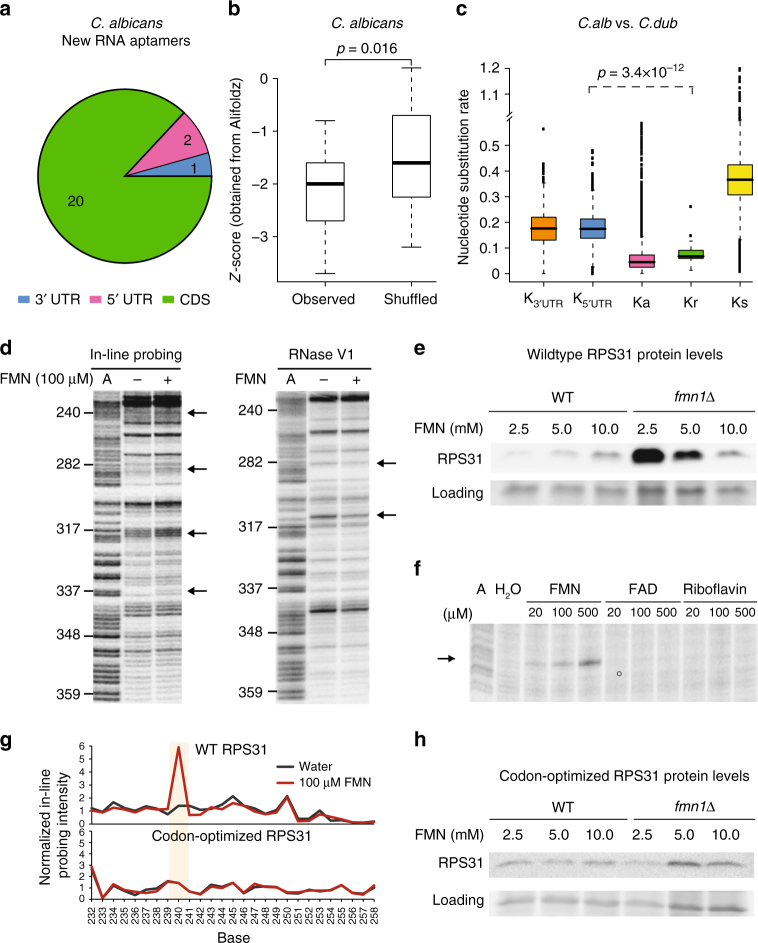
Fig. 4.
PARCEL identifies new RNA aptamers in Candida albicans. a Pie chart of the number of C. albicans RNA aptamers that are located in 5′ UTR, CDS, and 3′ UTR. The majority of C. albicans RNA aptamers are found in CDSs. b Comparison of the distribution of Alifoldz scores for RNA aptamers vs. shuffled counterpart. The upper, middle, and lower bounds of the boxplot represent the 75, 50, and 25th percentile of the values, respectively. A negative score indicates a stable, conserved consensus structure. P-value was obtained using the non-parametric Kolmogorov–Smirnov test. c Nucleotide substitution rates, calculated as the number of substitutions per base-pair, for RNA aptamers (Kr), 3′ UTR (K3UTR), 5′ UTR(K5UTR), synonymous sites (Ks), and non-synonymous sites (Ka). The upper, middle, and lower bounds of the boxplot represent the 75, 50, and 25th percentile of the values, respectively. C. albicans SC5314 was compared to Candida dubliniensis for the calculation. p-value was obtained using the non-parametric Kolmogorov–Smirnov test. d Gel analysis of RPS31 mRNA using in-line probing (left) and RNase V1 (right) in the presence (lane 3) and absence (lane 2) of 100 µM FMN. The A ladder (A, lane 1) is also shown. The black arrows indicate positions along the RNA that changed in the presence of FMN. e A representative Western blot showing RPS31::FLAG (top) and loading (bottom) protein levels in RPS31::FLAG knock-in strains with WT (left) and fmn1∆ (right) backgrounds cultured at different FMN concentrations (mM). Using t-test (n = 8), significant p-values of 0.009 and 0.01 (for 2.5 and 5.0 mM against 10.0 mM, respectively) were determined for fmn1∆, but not WT (p-values of 0.2 and 0.5). f Gel analysis of RPS31 mRNA using in-line probing in the presence of 20, 100, or 500 µM of FMN, FAD or riboflavin. In-line probing of RNA in the absence of metabolite (H2O, lane 2) and A ladder (A, lane 1) are also shown. g SAFA analysis of WT RPS31 (top) and codon-optimized RPS31 (bottom) in the presence (red line) and absence (black line) of 100 µM FMN. The beige box indicates the region of structural change in WT RPS31 when it interacts with FMN. This structural change is absent in the codon-optimized RPS31. h A representative Western blot showing codon-optimized RPS31::FLAG (top) and loading (bottom) protein levels in codon-optimized RPS31::FLAG knock-in strains with WT (left) and fmn1∆ (right) backgrounds cultured at different FMN concentrations (mM). Using t-test (n = 3), calculated p-values for 2.5 and 5.0 mM were insignificant for both fmn1∆ (both 0.7) and WT (0.9 and 0.09)

