Abstract
This paper reports a reconfigurable microfluidic dilution device for high-throughput quantitative assays, which can easily produce discrete logarithmic/binary concentration profiles ranging from 1 to 100-fold dilution in parallel from a fixed sample volume (e.g., 10 μL) without any assistance of continuous fluidic pump or robotic automation. The integrated dilution generation chip consists of switchable distribution and collection channels, metering reservoirs, reaction chambers, and pressure-activatable Laplace valves. Following the sequential loading of a sample, a diluent, and a detection reagent into the individual metering chambers, the top microfluidic layer can be reconfigured to collect the metered chemicals into the reaction chambers in parallel, where detection will be conducted. To facilitate mixing and reaction in the micro-chambers, two acoustic microstreaming actuation mechanisms have been investigated for easy integratability and accessibility. Furthermore, the microfluidic dilution generator has been characterized by both colorimetric and fluorescent means. A further demonstration of the generic usage of the quantitative dilution chip has utilized a commonly available bicinchoninic acid (BCA) assay to analyse protein concentrations of human tissue extracts. In brief, the microfluidic dilution generator offers a high-throughput high-efficiency quantitative analytical alternative to the conventional quantitative assay platforms, by simple manipulation of a minute amount of chemicals in a compact microfluidic device with a minimal equipment requirement, which can serve as a facile tool for biochemical and biological analyses in regular laboratories, point-of-care and low-resource environments.
Introduction
As a critical preparatory step, dilution generation has been a routine practice and gold standard to form quantitative readings of a wide variety of biological and biochemical assays. It is frequently utilized in sample preparation where samples are diluted into a series of concentrations for quantification with an assay. For instance, in a serology laboratory, patient’s serum is typically diluted 5-10 times in series to determine the exact amount of total proteins,1 cytokines,2, 3 creatinine,4 or certain antibodies5 present in the sample. Moreover, in the calibration step of quantitative assaying, dilution generation has been used to generate a standard curve whenever an indicator-labelled detection method is conducted.5–6 Specifically, in the cytokine immunoassay, a standard curve can be plotted by reading fluorescence intensities of the pre-prepared serial dilutions from a known concentration, while the measurement result from the cytokine-containing sample with an unknown concentration can be interpolated from the standard curve. Another common strategy is to utilize serial dilution for quantitative determination of drug responses.7 For instance, in a half maximal inhibitory concentration (IC50) assay, a dose-response curve is constructed by successively diluting the original enzyme inhibitor solution till the enzyme activity reaches 50% of the maximal level.8 Requirement of different concentration profiles, e.g., linear vs logarithmic, is highly application-dependent. For instance, physiological studies, e.g., cancer metastasis, cell immune response, and axon guidance, mostly favour a linear concentration within a small range, while pharmacological examinations, e.g., drug screening, cytotoxicity and dose-response assays, require logarithmic or exponential concentrations, which may span across several orders of magnitude.8
To date, the standard dilution processes still heavily rely on either laborious manual operations9 or expensive robotic automations10 in both of which similar dilution steps are repeated in sequence to create a concentration distribution with a low efficiency. Particularly, for quantitative biomolecular analysis, such as characterization of enzyme inhibitors, dilution generation has still been the most time-consuming step with substantial reagent consumptions.11 Similarly, quantitative immunoassay requires a standard curve formed on a multi-well microplate by serial dilution, which consumes multiple vials in the plate, each containing more than 100 μL of reagents.12 Recently, a variety of microfluidic devices have been developed for specific detection of infectious antigens, cancerous and cardiovascular biomarkers,13–20 however, the quantitative calibration function still mainly relies on manual dilution protocols.21, 22
Notably, extensive research and development efforts have been recently invested into establishing dynamic concentration gradients using microfluidic concepts pioneered by Whitesides group.23, 24 Unfortunately, there are only very limited references on creating discrete dilution profiles employing such an on-chip approach, despite its clinical importance and widespread practical utilities.5 The key difference between dynamic gradient generation and discrete dilution generation is that the former one focuses on creating a gradual and continual concentration distribution, whereas the latter one aims at achieving discrete concentration profiles in separate channels or chambers.25 Three approaches utilizing continuous flow sources have been demonstrated to establish discrete dilution profiles: diffusive dilution,6, 26 volumetric dilution,27 and digital serial dilution.28 The diffusive methods dilute samples in serially stacked stages of split-combine channels,6, 29 while the volumetric methods divide samples into different volumetric proportions and then mix to create the final discrete concentrations.27, 29 Moreover, the digital microfluidic dilution platform consists of an array of microvalves that can be programmed to perform reagent routing, mixing, rinsing, and dilution, all in series.28 However, these emerging approaches all require continuous flow driven by a pumping or vacuum source, which is often unavailable in clinics or point-of-care settings. Importantly, clinical samples are typically collected in a fixed volume, and thus, the continuous flow assay is either incompatible with the sample size or results in a decreased sensitivity and accuracy.30 More recently, Ismagilov group has reported a reconfigurable microfluidic design, known as SlipChip, which enables exposure of one sample to multiple reagents in small volumes by preloading and slipping without pumps or valves.31 Nevertheless, sliding and realignment between loading and reaction can be challenging, while only a limited range of concentration profiles can be provided using this approach. Therefore, there is an unmet demand for on-chip assay platforms to provide wide-range dilution profiles from a fixed-volume sample, using an approach that requires minimal equipment investment and personnel skills, for quantitative biomolecular analyses in clinical and point-of-care settings.
To tackle the aforementioned challenges, we report the first reconfigurable microfluidic dilution generator capable of producing digital and discrete dilution profiles from a fixed sample volume. It only requires limited operation steps without involvement of any complicated equipment or external pumping source. Specifically, given a fixed-volume sample (e.g., 10 μL), the microfluidic dilution device is capable of generating linear, logarithmic, or arbitrary dilution by involving three simple steps as follow. The injection step produces the targeted dilution volumes into paired chambers from both the sample and diluent, with a fixed volume of detection reagent for each division, meanwhile undesired fluidic mixing among injection channels is prevented by embedded Laplace valves.32 Unlike the previous study, however, this device can implement both logarithmic dilution and quantitative assaying in single device operations. By delaminating the top injection layer, the microfluidic network is reconfigured into parallel combination channels, followed by suction into the final mixing chambers via the activated Laplace valves. Two acoustic mixing strategies have been implemented to facilitate mixing process and ensure solution uniformity across the device, which are low-power bubble-induced microstreaming mixing for on-site use, and ultrasonic water bath mixing for common laboratory use. We have demonstrated the dilution function by proportional combination of two colorimetric dyes and logarithmic dilution of bovine serum albumin (BSA)-fluorescent solution (FITC) conjugate. As a practical biological demonstration, a commonly used bicinchoninic acid (BCA) assay has been implemented on the microfluidic dilution chip to quantify protein concentrations in human tissue extracts, in which both standard curve generation and quantitative assaying can be achieved. Notably, the operational procedure is completely compatible with standard biological protocols for many homogenous quantitative assays, while requiring minimal personnel training and low equipment cost, highly attractive for both clinical analysis and in-field testing. Overall, this microfluidic chip is capable to serve as a novel replacement for current manual serial dilution within 100 folds, and a facile tool for quantitative assays.
Design
The proposed parallel dilution device for high-throughput quantitative assay is enabled by a reconfigurable microfluidic network as shown in Fig. 1. Specifically, the dilution generator consists of three micropatterned layers. As shown in Fig. 1, the top layer with horizontal distribution channels connects metering reservoirs in the bottom layer via a through-hole membrane. In addition, vertical collection channels with embedded Laplace valves are included in the bottom layer to merge the fluids from metering reservoirs into separate reaction chambers. The pressure threshold to activate the Laplace valves can be determined by the change of the dimensions as well as the surface chemistry of channels.33, 34 A negative pressure of 4.4 kPa has been determined to activate all the Laplace valves at once. In the current design, the volume of sample metering reservoirs is set to increase in a logarithmic fashion at base 2, while that of the diluent chambers decreases in a complementary way keeping the total volume constant, which leads to formation of a standard binary dilution profile. 35 Notably, the design principle is flexible and allows one to design linear, logarithmic, and any arbitrary dilution profiles by adjusting the metering chamber dimensions. In addition, identical metering reservoirs of detection reagents are integrated to perform the subsequent molecular analysis in the reaction chambers.
Fig. 1.
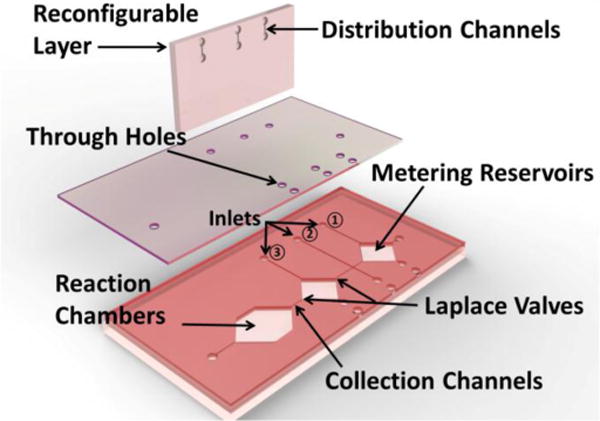
Structural assembly of dilution unit (only one unit is shown) for the reconfigurable microfluidic dilution generation device. ①, ② and ③ indicate the inlets of diluent, sample, and detection reagent channels, respectively.
Fig. 2 illustrates a generic protocol to perform such a quantitative assay. In particular, sample, diluent, and detection reagent are successively loaded by a micropipette through the inlets into the horizontal distribution channels with separable reservoirs (Fig. 2b). In the next step, the top layer with horizontal distribution channels can be manually removed and replaced by a flat piece of silicone, leaving only fluidic passage to the vertical direction, where Laplace valves prevent different chemicals from mixing together (Fig. 2c). A negative activation pressure is then applied manually to draw all chemical contents from each vertical passage into corresponding reaction chambers,30 where active acoustic mixing strategies can be utilized to facilitate the targeted assaying in the following step (Fig. 2d). A demonstrative video illustrating the entire process in Fig. 2 is provided in the Electronic Supplementary Information. Alternatively, all outlets can be connected to a common port through microfluidic binary tree channels so that all the Laplace valves can be activated simultaneously (see Fig. S1). 33 In summary, the microfluidic dilution generator comprises only three simple steps of operation: loading, reconfiguration, and collection/reaction, which can be applicable to a wide variety of biological and biochemical assays for high-throughput and quantitative outcomes.
Fig. 2.
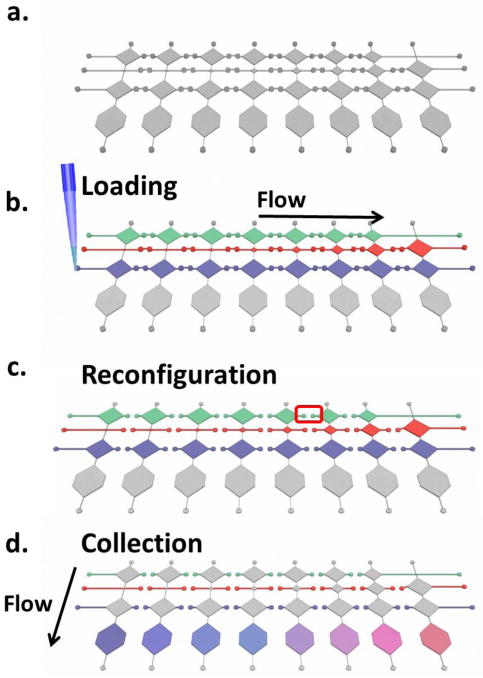
Illustrative procedures for dilution generation, where sample, diluent and detection reagent channels are shown from the top to the bottom in each figure. a) Device prior to the test. b) Sequential injection of diluent, sample, and detection reagent. c) Microfluidic reconfiguration. d) Metered liquids are driven to the final chambers and mix/react with each other to form dilution profiles.
Another challenge to solve is on-chip reagent mixing. Efficient mixing is essential for achieving a uniform dilution gradient on the microfluidic chip. A number of mixing methods have been proposed for microfluidic channels,36–39 however, it could still be difficult to effectively mix fluids in a low aspect ratio chamber. Without an active mixing approach, the uniformity of the mixture solely relies on the diffusion process, following Fick’s law,40 which may require an extended period to reach homogeneity, depending on the molecular dynamics, significantly delay reaction time and reduce assay efficiency accordingly. In the first method, we have employed an acoustic microstreaming strategy to realize mixing of reagents in the reaction chamber, in which a trapped array of peripheral air bubbles is oscillated by an attached piezoelectric transducer. In particular, air bubbles are spontaneously formed and retained inside six recessed air pockets (hydrophobic in nature) as the mixture fills in, which are equally distributed across the periphery of the main reaction chamber. Under the acoustic actuation by the piezoelectric transducer, the liquid-bubble interfaces function as dynamically vibrating acoustic sources for liquid mixing, also known as acoustic micromstreaming.41–43 However, in the second method, we have utilized a regular ultrasonic bath, commonly available in biology and biochemistry labs, which eliminates the requirement for adding peripheral air pockets in the reaction chamber design.
Materials and methods
Fabrication
Direct laser micromachining was employed to fabricate all three layers of the microfluidic dilution device in the engraving mode. Specifically, pre-designed microfluidic channel patterns of each layer were directly laser-cut onto a thin silicone sheet with the thickness of 254 μm (Rogers Corporation Bisco™ HT-6240) by a desktop CO2-pulsed laser machine (VersaLaser, Universal Laser), of which the maximal power was 10 W and the minimal beam width can be as small as 25.4 μm. For the Laplace valve fabrication, we applied 6.5% power with 1% speed and 1000 dpi resolution, while for rest of the chip we applied 4.5% power with 1% speed and 1000 dpi resolution. Specifically, the horizontal distribution channels were 200μm in width, while the Laplace valves were etched by the laser engraver in its highest resolution mode, which led to approximately a minimal width of 50 μm. Moreover, the dimensions of the reaction chambers were highly dependent on the specific assay design. For the demonstration, volume of the first sample metering reservoirs was 18 nL, that of the second one was 36 nL, and etc., which increased logarithmically at a base of 2. While that of the diluent chambers decreased in a complementary way, in order to keep the total volume constant (e.g., the corresponding first and second diluent chambers possessed a volume of 2268 nL and 2250 nL, respectively), as described in the Design section. Identical metering reservoirs (of 2286 nL) for detection reagents were also included. Subsequently, the engraved silicone sheets were rinsed and cleaned by ethanol and DI water successively. In the following step, the middle and bottom layers of the microfluidic network were bonded together and attached onto a glass slide through an oxygen plasma treatment on both sides for 1 minute at a high power setting (Harrick Plasma). At last, the reconfigurable top layer was placed and aligned onto the middle layer through oxygen plasma treatment only on one side. To minimize the dead volume, the reaction chambers were designed with rounded corners.44 In the BCA protein assay experiment, we doubled the height of all reaction chambers to 508 μm in the fabrication step and shrunk the footprint of reaction chambers to half of their original sizes in order to improve optical detection sensitivity in lower concentration range (15–50 μg/mL).
Acoustic mixing setup
In order to facilitate mixing and reaction in the reaction chambers, two acoustic mixing strategies were investigated, including microstreaming mixing activated by a piezoelectric transducer and direct agitation inside an ultrasonic bath.
For acoustic microstreaming mixing, a circular piezoelectric transducer with a radius of 15 mm, purchased from RadioShack (Model 273-073) was glued onto a polystyrene substrate using an epoxy glue. Subsequently, the dilution generation chip was bonded to the substrate using an oligomer transfer method reported previously.45 To activate the mixing process, 1.28 kHz square wave signal was generated by a function generator (Agilent 33220A) at 5 Vpp and 50% duty cycle and applied to the transducer. To achieve rapid vortex formation in the chamber, frequency of square wave signal was tuned to reach the resonant frequency of a large air bubble. Alternatively, an ultrasonic water bath (Branson 200, 120V, 40 kHz) was used to implement the active mixing process during which the microfluidic dilution generator was directly immersed into the water-containing tank.
Reagents
For the colorimetric dilution test and mixing characterization, 1.5 g/L aqueous solutions of soluble dyes (Jacquard iDye Natural Fabric Dye No. 451 Blue and No. 449 Red) were prepared by dissolving dry powder in water. For the quantitative fluorescent dilution experiment, bovine serum albumin (BSA)-fluorescein isothiocyanate (FITC) conjugates (PH: 8-9, from Hammock Lab) at 3.5 μg/mL and phosphate buffered saline (PBS) were prepared as the sample and diluent to be processed on the chip.
The protein assay experiment was conducted using a BCA protein assay kit (Thermo Scientific Pierce, Product No. 23225), which included two reagents: Reagent A containing sodium carbonate, sodium bicarbonate, bicinchoninic acid and sodium tartrate in 0.1 M sodium hydroxide and Reagent B containing 4% cupric sulphate. Prior to assaying, a working reagent was prepared by mixing Reagent A and B in 50:1 ratio as a detection reagent. In addition, a 2000 μg/mL bovine serum albumin (BSA, Sigma-Aldrich) solution in PBS was made as calibration standards for protein quantification in human organ extracts. S9 fractions of pooled (4–50 persons) organ tissue extract samples of liver, kidney, intestine, and lung, respectively, were acquired from a company (Xenotech LLC, Lenexa, KS).
Operation
As we mentioned, three steps were involved: loading, reconfiguration, and collection/reaction. In the loading step, 7 μL of sample, 20 μL of diluent and 27 μL of detection reagent were loaded through the sample, diluent and detection reagent channels onto the chip respectively by a pipette manually (as shown in Fig. 2). During the microfluidic reconfiguration, the top channel layer was peeled off, replaced and sealed by a piece of solid silicone sheet. At the final collection step, a pipette was used to draw stored fluids in each metering reservoir into the corresponding reaction chambers in the vertical direction. It is worth noting that the devices were designed to be washable and can be reused for multiple times according to our studies. The washing procedure followed a similar protocol to the aforementioned loading process, instead, it used a rinsing solution in each channel (application-dependent).
Specifically, in colorimetric experiment, red dye solution, DI water and blue dye solution were injected into sample, diluent, and detection reagent channels for visual demonstration. In fluorescent experiment, BSA-FITC solution and PBS solution were used as sample and diluent. Similarly in the characterization of standard curve of protein assay, 2,000 μg/mL BSA solution, PBS buffer, and working reagent were loaded into the sample, diluent and detection reagent channels of microfluidic dilution chip respectively. Meanwhile, in the protein quantification assay, human tissue extracts were loaded into the sample channel and a set of mixtures was generated in the reaction chambers using the aforementioned protocol. Each run of the experiment consumed a 10 μL extract sample.
In addition, a reference curve showing the relative fluorescent intensities of BSA-FITC solutions versus various concentrations was prepared by manual dilution as a comparison. This fluorescent experiment was repeated for four times, and averaged normalized intensities values with standard derivation of both on-chip and manual dilution groups were plotted. Similarly in the characterization of standard curve of protein assay, 15 different concentrations (in the range of 16 μg/mL -2,000 μg/mL) of BSA was prepared by manual serial dilution as a reference and mixed with equal volume of working reagent in 15 reaction chambers on a calibration chip that had identical physical dimensions with the microfluidic dilution chip. In the protein quantification assay, protein concentrations of human organ tissue extracts were calculated based on the standard curve of on-chip diluted BSA standards. Subsequently, both the reference group and on-chip dilution group were sealed by a silicone sheet and incubated at room temperature for 2 hours before imaging.
Imaging and Data Analysis
To evaluate colorimetric mixing performance, microscopic images were continuously recorded (EVOS XL Core Imaging System, 30 frames/second) during the mixing of red and blue dyes inside a reaction chamber. RGB information of these microscopic images was extracted, and standard derivation of colour intensities in all pixels was analysed in MATLAB. A smaller number of the derivation value implied a more uniform mixing result. To simultaneously read the colorimetric BCA protein assay results over eight chambers, a desktop scanner (Onetouch 7300 USB, Visioneer) was used to scan the protein assay chips for optical imaging at 1000 dpi.46 For colorimetric analysis of the BCA protein assay, the parameter of saturation intensity was selected to characterize the image results, as it was closely correlated with BCA concentrations.47 Specifically, scanned images were transformed into numerical colour values and averaged over a freely selectable square area using colour picker tool in a PC image processing software. Averaged saturation intensities of 3 freely selected square areas (3 × 3 pixels) in the area of each reaction chamber were plotted against the logarithmic axis of the corresponding concentrations, and curve fitting of saturation intensities versus known concentrations was performed on manual dilution group as a reference.
For fluorescent imaging, fluorescein was excited by a pulsed high power LED at 490 nm (150 mA, 2 Hz, and 10% duty cycle, 2 s, Thorlabs M490L2 and DC2100) passing through a FITC filter set (Thorlabs, MDF-FITC). Eventually, the filtered fluorescent images were recorded in the centre of each reaction chamber by a CCD sensor of Canon 550D camera (2.5 s, ISO 6400). Recorded fluorescent images were converted into grayscale images and the mean intensity of each picture was measured and normalized using a MATLAB program.24, 48
For the protein concentration measurement of human organ extracts, one assay led to several readouts at different dilutions, the concentrations of which were interpolated from the reference curve and dilution factors were applied to acquire the original undiluted concentration. And calculated concentrations from the same chip were averaged to get a final measurement value.
Results and Discussion
Mixing Performance
The mixing performance of the acoustic bubble-array actuator was evaluated by mixing blue and red soluble dyes at 1:1 ratio in the reaction chamber, as shown in Fig. 3. Oscillation of the liquid-bubble interface driven by the acoustic energy led to microstreaming in the mixture. The maximal actuation can be achieved at an acoustic resonance of the liquid-air interfaces in the air pockets, which is predicted to be 1.28 kHz by the Rayleigh–Plesset equation.49 Moreover, the bubble entrapment was substantially influenced by the surface chemistry of the constructs (i.e., hydrophobicity) as well as the geometrical design. Given the hydrophobic nature of the PDMS constructs and the recess design of the air-trapping chambers, the bubble entrapments were formed spontaneously during the loading process and can be highly repeatable. However, there could still present an appreciable variation (up to 15%) in the size of the trapped bubble, which can affect the resonant frequency of acoustic mixing as a larger bubble typically had a lower resonant frequency. Therefore, when excited at a lower frequency, the acoustic oscillation of a larger air bubble would dominate the microstreaming process, as can be seen in Fig. 3, where the larger bubble at the left corner caused an appreciable vortex formation in the centre of the chamber in a clockwise fashion. The coloured boundaries gradually became blurry after 3 minutes of actuation when colour homogeneity was reached.
Fig. 3.
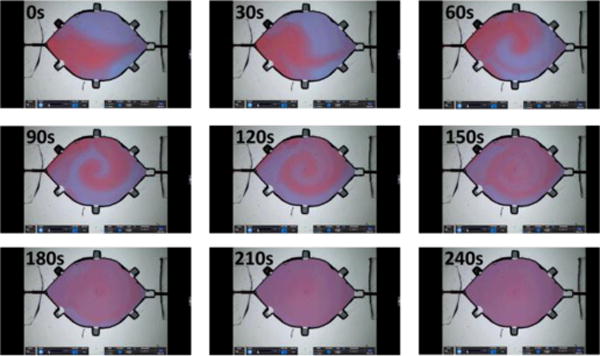
Snapshots of dynamic bubble-array acoustic microstreaming mixing in a reaction chamber every 30 seconds.
To quantify the efficiency of acoustic mixing, we have adopted a dye dispersion characterization method described in previous study.37 Quantitative changes of homogeneity in colour intensities over time were plotted from both experimental and control groups, as shown in Fig. 4. As expected, a smaller variation implied a more uniform mixing result. The normalized standard derivation of colour intensity in experimental group declined to a level below 0.1 in 3 minutes, meanwhile that of the control experiment changed slightly during the same observation period. It took approximately 1 hour for the control group to reach the same level of uniformity as the experimental group. As a result, both the qualitative and quantitative evidences confirmed that the acoustic microstreaming configuration successfully accelerated mixing process in a low aspect ratio reaction chamber by at least 20 folds. It is worth noting that supply voltage of bubble-array acoustic mixing was set at 5Vpp and the power consumption was approximately 90mW, and thus this mixing configuration can be extracted from a mobile device (e.g., cellphone or tablet) and become more suitable for point-of-care and on-site use.
Fig. 4.
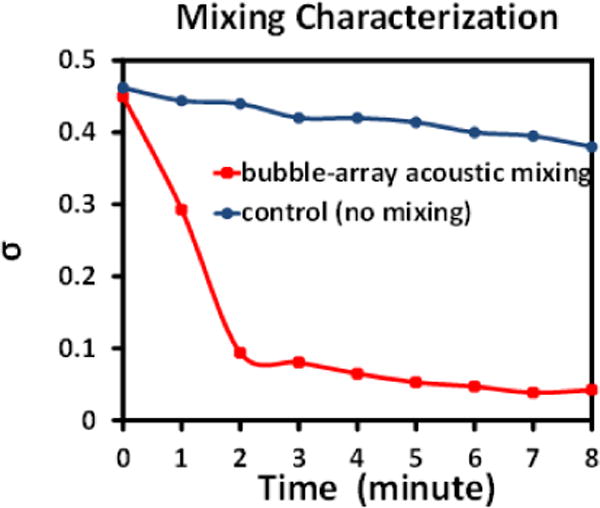
Plot of the standard derivation (σ) of the colour intensity in a reaction chamber with bubble-array acoustic microstreaming mixing, as a function of mixing time. The time-evolving data of a single continuous experiment was extracted from continuous snapshots at a 1-minute interval. Control group was plotted based on passive diffusion without acoustic mixing.
Additionally, for lab usage, an alternative option is to use active agitation by an ultrasonic water bath. Ultrasonic cleaning utilizes cavitational microstreaming50 induced by high frequency pressure sound waves to agitate a liquid. In contrast with bubble-array acoustic microstreaming method, for the ultrasonic operation, there is no air pocket needed for the mixing performance. Thorough mixing can be easily implemented by immersing the chip in an ultrasonic water bath with approximately 100 W power level. Not only can the design of peripheral bubble array be omitted, but also the mixing time was reduced to as low as a few seconds for a reaction chamber of 3 mm×5 mm×254 μm. Fig. 5 shows the comparison of mixing performances by these two methods along with a control. As can be seen, mixing in an ultrasonic bath could reached the same degree of uniformity as that of the bubble-array microstreaming mixing during the same time frame, both of which illustrated the effective mixing performance with active agitation as compared to the control group. In addition, the ultrasonic bath mixing provided a facile mixing scheme without any electronic control and drive and can be a convenient choice for laboratory researchers.
Fig. 5.
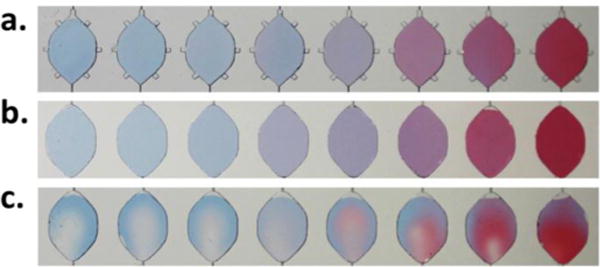
Mixing performances by, a) bubble-array microstreaming mixing, and b) ultrasonic bath mixing in comparison with c) a control group without external active mixing.
Qualitative and quantitative analysis of parallel dilution generation
In order to evaluate the performance of parallel dilution generation performance on the microfluidic chip, both colorimetric and fluorescent dilution experiments were conducted for qualitative and quantitative analysis respectively. In the colour dye dilution experiment, a distinct colour gradient was established in the bottom reaction chambers after performing the parallel dilution process directly on the chip by mixing blue and red dye solutions. As can be seen in Fig. 6, the gradient gradually changed from a pure blue on the left to pure red on the right with intermediate colours in between due to increasing ratio of the red to blue dyes.
Fig. 6.
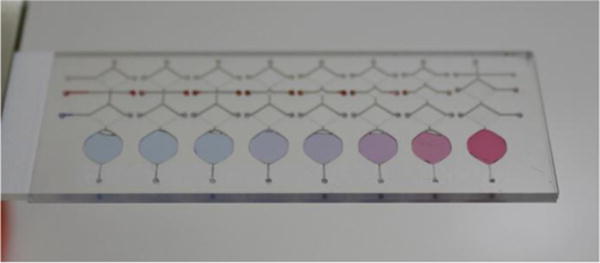
Parallel dilution profiles characterized by colorimetric red and blue dyes.
To further evaluate the accuracy of this dilution generation, a quantitative fluorescent dilution experiment was conducted using the same chip design. Fig. 7 shows the normalized fluorescent intensities versus normalized concentrations after performing the dilution on the chip with a control group conducted by manual serial dilution. Both measurements were repeated four times over four identical devices. As shown in the manual dilution control group, the fluorescent intensity showed a linear relationship with FITC concentrations within the 1:100 dilution range (0.4 nM-53 nM).51 A fitting curve was generated from manual dilution group as a reference. For the on-chip dilution group, the eight data points represented the readings from the corresponding chambers, while the concentrations were calculated from chip design. Fluorescent intensities of the on-chip dilution group followed a clear binary declining trend in these eight chambers, demonstrating a log 2-based dilution profile as observed. Notably, deviation of the on-chip dilution group from the manual one in the lowest concentration (0.4nM) can attribute to dead volumes and physical adsorption of BSA-FITC molecules by the silicone substrate.52 In summary, both qualitative colorimetric results and quantitative fluorescent results demonstrated that this dilution generator was capable of generating discrete parallel dilution profiles across multiple reaction chambers with a logarithmic concentration distribution.
Fig. 7.
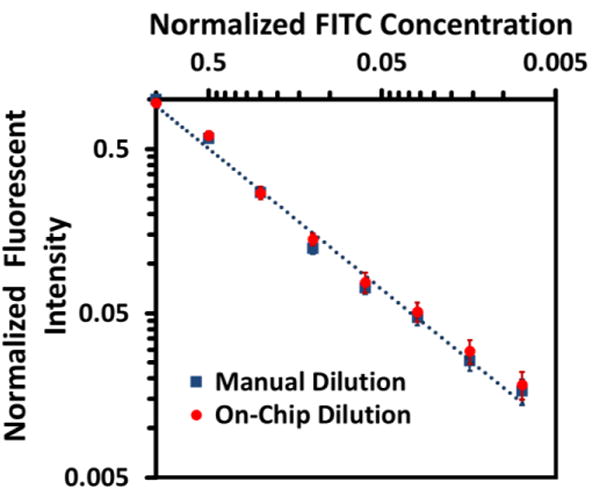
Plot of fluorescent intensities in eight reaction chambers, generated by on-chip dilution (red dots), with a control group by manual dilution (blue squares), in logarithmic scale. Mean values with standard derivation bars of 4 repeats have been plotted. The blue dotted line is the fitting curve of manual dilution group as a reference curve.
Protein Assay
Nucleotide polymorphisms of human enzymes, such as soluble epoxide hydrolase, have been found to be associated with various diseases ranging from increased cardiovascular risks to ischemia, kidney failure, and anorexia, underlying the potential clinical importance of human enzymes and its natural mutants.53 In the study of alteration in enzyme activity in polymorphisms, it is always necessary to measure enzyme activity in wild-type human tissue extracts as comparison. Protein quantification is a routine preparation step in quantifying enzymes production in vivo.54, 55 Here we have demonstrated use of the dilution chip for protein quantification in S9 fractions of pooled (4–50 persons) human tissue samples, which come mostly from the wild-type genotype, to represents 60%-70% of the population. 53, 56 S9 fraction is the product of an organ tissue homogenate, which is a mixture of microsomes and cytosol. S9 fractions contain a wide variety of drug metabolizing enzymes and are commonly used to support in vitro metabolism and excretion studies, including xenobiotic metabolism. As one of the most commonly used protein assays, the bicinchoninic acid (BCA) assay, based on reduction of cupric ions by proteins in an alkaline environment and purple-coloured chelation reaction of BCA with reduced (cuprous) cations, offers a simple-to-operate colorimetric detection and quantification of total protein contents, benefitting from its high compatibility with detergents and excellent protein-to-protein uniformity, for which we have selected it as the model assay.57 Human organ tissue extracts may have original protein concentration higher than the maximal range of standard BCA protein assay (2,000ug/mL), which makes the dilution procedure necessary for real sample processing. With a calibration curve, measurements of protein concentrations have been conducted in 4 human organ tissue extracts from liver, kidney, intestine, and lung (smokers and non-smokers), respectively. Both samples and BSA standards have been diluted on this chip. Measurement of each type of human tissue samples has been repeated for three times on three identical devices.
Prior to the sample measurement, the standard BCA curve was generated for verification purpose. Fig. 8 plots the colour intensity values versus the BSA concentrations prepared by both the conventional manual dilution and our microfluidic approach. As can be seen, 15 concentrations generated by the manual serial dilution (ranging from 16 μg/mL to 2,000 μg/mL) were measured with the corresponding saturation intensities (blue squares). In comparison, the 8 data points (red dots) of the microfluidic dilution were acquired by the on-chip dilution process designed within the same concentration range from 16 μg/mL to 2,000 μg/mL, accommodating the binary dilution design on the chip. Both measurements were repeated three times over three identical devices. As expected, both the manual and microfluidic dilutions produced consistent measurement results with marginal standard deviations. The consistency of this colorimetric characterization method proved to be reliable, as the standard derivation bars turned out to be marginal to be seen on the graph. More importantly, the results from the standard and microfluidic means were in a close agreement with each other in the concentration range of interest (20-2,000 μg/mL), which is the typical working range of BCA protein assay used in both standard test tube and microplate protocols.58
Fig. 8.
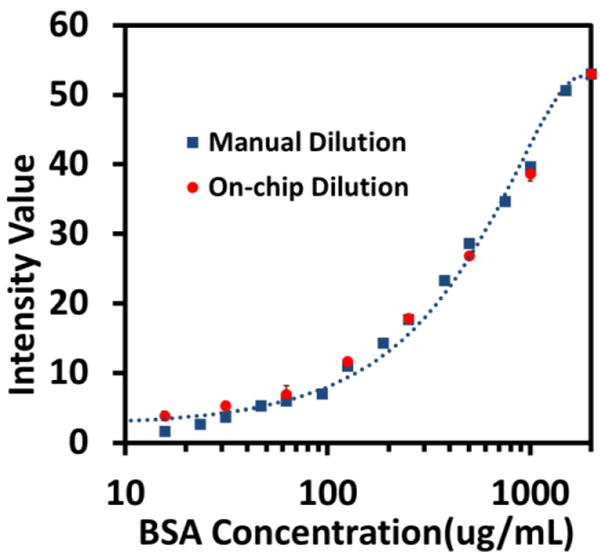
Calibration curve of quantitative BCA protein assay generated by both conventional manual dilution (blue squares) and the on-chip dilution (red dots) with a fitting curve of the manual dilution as a reference curve. Quantitative colorimetric readouts are characterized by the saturation intensity values vs BSA concentrations (in logarithmic scale) in which mean intensity values with standard derivation of 3 repeats are plotted.
Table 1 summarizes the measurement results of S9 fractions of pooled (4–50 persons) organ tissue extract samples. As can be seen, majority of the measurement results by the microfluidic dilution chip closely followed the referenced values reported by the conventional microplate methods with less than 10% deviations. However, the liver tissue extract measurement exhibited a significantly elevated value from our chip readout. The cause of error can possibly attribute to the reducing agents and chelating agents contained in the sample, such as lipids, creatinine and cysteine. To further improve the chip performance for different assays, the volume of the working reagent can be further increased, and thus, enhance the signal to background ratio.
Table 1.
Protein quantification results of human tissue extracts with this dilution chip, compared with reference.
| Source of Human Tissue Extracts | Protein Concentration(mg/mL) | |
|---|---|---|
| Reference | On-chip measurement | |
| Intestine | 4.23 | 4.23±0.44 |
| Lung(smokers) | 4.49 | 4.45±0.35 |
| Lung(non-smokers) | 4.92 | 5.10±0.4 |
| Liver | 16.98 | 23.19±0.2 |
| Kidney | 4.15 | 3.68±0.03 |
In summary, in our model assay, the protein level from 20 μg/mL to 2,000 μg/mL can be quantitatively and reliably detected, by offering the equivalent level of detection sensitivity and accuracy with conventional protocols. Moreover, as compared to the conventional test tube and microplate methods, the consumption of protein solution has been greatly reduced from 1,000 μL to less than 10 μL overall (more than 100-fold saving). As a key user-friendly feature, the manual operations of repetitive pipetting in conventional dilution protocol have been largely avoided, thus reducing the requirement of excessive labour and additional levels of training. In conclusion, for colorimetric analysis of the BCA protein assay, our device provides an apparent technical edge over the existing assay platforms, which can provide a simple method to directly generate a reference calibration curve for microfluidic assays and address the existing challenge for point-of-care assay without quantitative readouts. It is our goal that the microfluidic dilution chip would eventually allow a classical quantitative bioassay to be operated by hand with minimal training, but still generate highly accurate measurement results for low-resource settings or point-of-care applications. Based on the successful proof-of-concept demonstration of a generic protein assay, this dilution generation device can be readily used for a variety of homogenous assay applications, which require similar and standardized dilution procedures consecutively, e.g., cholesterol assay,59 and cortisol assay.60
Conclusions
This paper reports a reconfigurable microfluidic dilution device for high-throughput quantitative assay, which can produce discrete logarithmic/binary concentration profiles ranging from 1 to 100-fold dilution in parallel from a fixed sample volume (of 10 μL) without assistance of continuous fluidic pump or vacuum source. The operation procedure of simply pipetting in a “sample-to-answer” fashion makes it applicable for non-trained personnel to perform generic quantitative biomolecular assays. The microfluidic dilution generator has been characterized by both colorimetric and fluorescent means. Two plug-and-play acoustic mixing strategies have been implemented specifically for regular chemical or biological lab settings. Mixing performance has been characterized with at least 20-fold enhancement in the mixing rate. As a generic demonstration of the utility of the microfluidic quantitative dilutor, a commercially available protein quantitation assay has been implemented successfully on this dilution chip, which covers the same detection range from 20 μg/mL to 2,000 μg/mL as the standard test tube and microtiter plate methods. The testing results verify high repeatability and excellent consistency between the standard and microfluidic approaches. In conclusion, permitting easy-to-operate protocols, quantitative and reliable readouts, and low chemical consumption, the reconfigurable microfluidic dilution generator can potentially offer a generic assay platform for homogeneous biochemical and biological analyses in regular laboratories, point-of-care and low-resource environments.
Supplementary Material
Acknowledgments
This work has been partly supported by National Science Foundation Awards ECCS-0846502 and DBI-1256193 to TP, in addition to National Institutes of Environmental Health Sciences of NIH Superfund Research Program (No. P42ES004699). JF acknowledges a fellowship support from the Howard Hughes Medical Institute Integrating Medicine into Basic Science (HHMI-IMBS) Training Program at UC Davis. BL acknowledges support of the Oversea Academic Training Funds from University of Science and Technology of China. Authors would like to thank Dr. Shirley J. Gee, Dr. Candace S. Bever, and Dr. Bruce D. Hammock (the Department of Entomology) for generously providing the BSA-FITC reagents and BCA kits, and thank Yijun Zhang for assistance on graphic illustrations.
Footnotes
Electronic Supplementary Information (ESI) available: More technical details and a video of demonstration has been provided.
Notes and references
- 1.Peterson GL. Method Enzymol. 1983;91:95–119. doi: 10.1016/s0076-6879(83)91014-5. [DOI] [PubMed] [Google Scholar]
- 2.Sissons JGP, Borysiewicz LK, Cohen J. Immunology of infection. Kluwer Academic Publishers; Dordrecht; Boston: 1994. [Google Scholar]
- 3.Chen A, Vu T, Stybayeva G, Pan T, Revzin A. Biomicrofluidics. 2013:7. doi: 10.1063/1.4795423. [DOI] [PMC free article] [PubMed] [Google Scholar]
- 4.Larsen K. Clin Chim Acta. 1972;41:209. doi: 10.1016/0009-8981(72)90513-x. [DOI] [PubMed] [Google Scholar]
- 5.Stanley J. Essentials of immunology & serology. Delmar Thomson Learning; Albany, NY: 2002. [Google Scholar]
- 6.Walker GM, Monteiro-Riviere N, Rouse J, O’Neill AT. Lab on a chip. 2007;7:226–232. doi: 10.1039/b608990a. [DOI] [PubMed] [Google Scholar]
- 7.Copeland RA. Evaluation of enzyme inhibitors in drug discovery : a guide for medicinal chemists and pharmacologists. Wiley-Interscience; Hoboken, N.J.: 2005. [PubMed] [Google Scholar]
- 8.Chen CY, Wo AM, Jong DS. Lab on a chip. 2012;12:794–801. doi: 10.1039/c1lc20548j. [DOI] [PubMed] [Google Scholar]
- 9.Harmening D. Clinical hematology and fundamentals of hemostasis. F.A. Davis Co.; Philadelphia: 1997. [Google Scholar]
- 10.Mack DR. Google Patents. 1989 [Google Scholar]
- 11.Newman JW, Morisseau C, Harris TR, Hammock BD. Proceedings of the National Academy of Sciences of the United States of America. 2003;100:1558–1563. doi: 10.1073/pnas.0437724100. [DOI] [PMC free article] [PubMed] [Google Scholar]
- 12.Turgeon ML, Turgeon ML. Immunology & serology in laboratory medicine. Elsevier/Mosby; St. Louis, Mo.: 2014. [Google Scholar]
- 13.Lee S, Oncescu V, Mancuso M, Mehta S, Erickson D. Lab Chip. 2014;14:1437–1442. doi: 10.1039/c3lc51375k. [DOI] [PubMed] [Google Scholar]
- 14.Srinivasan V, Pamula VK, Fair RB. Lab Chip. 2004;4:310–315. doi: 10.1039/b403341h. [DOI] [PubMed] [Google Scholar]
- 15.Sia SK, Kricka LJ. Lab Chip. 2008;8:1982–1983. doi: 10.1039/b817915h. [DOI] [PubMed] [Google Scholar]
- 16.Bromberg A, Mathies RA. Electrophoresis. 2004;25:1895–1900. doi: 10.1002/elps.200305818. [DOI] [PubMed] [Google Scholar]
- 17.Chin CD, Laksanasopin T, Cheung YK, Steinmiller D, Linder V, Parsa H, Wang J, Moore H, Rouse R, Umviligihozo G, Karita E, Mwambarangwe L, Braunstein SL, van de Wijgert J, Sahabo R, Justman JE, El-Sadr W, Sia SK. Nat Med. 2011;17:1015–U1138. doi: 10.1038/nm.2408. [DOI] [PubMed] [Google Scholar]
- 18.Coskun AF, Ozcan A. Current opinion in biotechnology. 2014;25:8–16. doi: 10.1016/j.copbio.2013.08.008. [DOI] [PMC free article] [PubMed] [Google Scholar]
- 19.Pan T, Wang W. Annals of biomedical engineering. 2011;39:600–620. doi: 10.1007/s10439-010-0218-9. [DOI] [PMC free article] [PubMed] [Google Scholar]
- 20.Chen A, Wang R, Bever CRS, Xing S, Hammock BD, Pan T. Biomicrofluidics. 2014:8. doi: 10.1063/1.4901348. [DOI] [PMC free article] [PubMed] [Google Scholar]
- 21.Martinez AW, Phillips ST, Carrilho E, Thomas SW, Sindi H, Whitesides GM. Analytical Chemistry. 2008;80:3699–3707. doi: 10.1021/ac800112r. [DOI] [PMC free article] [PubMed] [Google Scholar]
- 22.Bwambok DK, Christodouleas DC, Morin SA, Lange H, Phillips ST, Whitesides GM. Analytical Chemistry. 2014;86:7478–7485. doi: 10.1021/ac501206m. [DOI] [PubMed] [Google Scholar]
- 23.Jiang XY, Ng JMK, Stroock AD, Dertinger SKW, Whitesides GM. Journal of the American Chemical Society. 2003;125:5294–5295. doi: 10.1021/ja034566+. [DOI] [PubMed] [Google Scholar]
- 24.Dertinger SKW, Chiu DT, Jeon NL, Whitesides GM. Analytical Chemistry. 2001;73:1240–1246. [Google Scholar]
- 25.Folch i Folch A. Introduction to bioMEMS. CRC Press; Boca Raton: 2013. [Google Scholar]
- 26.Lee K, Kim C, Ahn B, Panchapakesan R, Full AR, Nordee L, Kang JY, Oh KW. Lab on a chip. 2009;9:709–717. doi: 10.1039/b813582g. [DOI] [PubMed] [Google Scholar]
- 27.Yamada M, Hirano T, Yasuda M, Seki M. Lab on a chip. 2006;6:179–184. doi: 10.1039/b514054d. [DOI] [PubMed] [Google Scholar]
- 28.Jensen EC, Stockton AM, Chiesl TN, Kim J, Bera A, Mathies RA. Lab on a chip. 2013;13:288–296. doi: 10.1039/c2lc40861a. [DOI] [PMC free article] [PubMed] [Google Scholar]
- 29.Lee K, Kim C, Kim Y, Jung K, Ahn B, Kang JY, Oh KW. Biomed Microdevices. 2010;12:297–309. doi: 10.1007/s10544-009-9385-6. [DOI] [PubMed] [Google Scholar]
- 30.Lenth RV. Am Stat. 2001;55:187–193. [Google Scholar]
- 31.Du W, Li L, Nichols KP, Ismagilov RF. Lab on a chip. 2009;9:2286–2292. doi: 10.1039/b908978k. [DOI] [PMC free article] [PubMed] [Google Scholar]
- 32.Yamada M, Seki M. Analytical Chemistry. 2004;76:895–899. doi: 10.1021/ac0350007. [DOI] [PubMed] [Google Scholar]
- 33.Zimmermann M, Hunziker P, Delamarche E. Microfluidics and Nanofluidics. 2008;5:395–402. [Google Scholar]
- 34.Man PF, Mastrangelo CH, Burns MA, Burke DT. Micro Electro Mechanical Systems - Ieee Eleventh Annual International Workshop Proceedings. 1998:45–50. [Google Scholar]
- 35.Minor L. Handbook of assay development in drug discovery. CRC/Taylor & Francis; Boca Raton: 2006. [Google Scholar]
- 36.Jiang X, Ng JM, Stroock AD, Dertinger SK, Whitesides GM. J Am Chem Soc. 2003;125:5294–5295. doi: 10.1021/ja034566+. [DOI] [PubMed] [Google Scholar]
- 37.Stroock AD, Dertinger SK, Ajdari A, Mezic I, Stone HA, Whitesides GM. Science. 2002;295:647–651. doi: 10.1126/science.1066238. [DOI] [PubMed] [Google Scholar]
- 38.Lee CY, Chang CL, Wang YN, Fu LM. Int J Mol Sci. 2011;12:3263–3287. doi: 10.3390/ijms12053263. [DOI] [PMC free article] [PubMed] [Google Scholar]
- 39.Mansur EA, Ye MX, Wang YD, Dai YY. Chinese J Chem Eng. 2008;16:503–516. [Google Scholar]
- 40.Park HY, Qiu XY, Rhoades E, Korlach J, Kwok LW, Zipfel WR, Webb WW, Pollack L. Analytical Chemistry. 2006;78:4465–4473. doi: 10.1021/ac060572n. [DOI] [PubMed] [Google Scholar]
- 41.Ahmed D, Mao XL, Juluri BK, Huang TJ. Microfluidics and Nanofluidics. 2009;7:727–731. [Google Scholar]
- 42.Liu RH, Yang J, Pindera MZ, Athavale M, Grodzinski P. Lab on a chip. 2002;2:151–157. doi: 10.1039/b201952c. [DOI] [PubMed] [Google Scholar]
- 43.Patel MV, Nanayakkara IA, Simon MG, Lee AP. Lab on a chip. 2014;14:3860–3872. doi: 10.1039/c4lc00447g. [DOI] [PubMed] [Google Scholar]
- 44.Chen A, Pan T. Lab on a chip. 2014;14:3401–3408. doi: 10.1039/c4lc00540f. [DOI] [PMC free article] [PubMed] [Google Scholar]
- 45.Ding YZ, Garland S, Howland M, Revzin A, Pan TR. Adv Mater. 2011;23:5551. doi: 10.1002/adma.201102827. [DOI] [PubMed] [Google Scholar]
- 46.Martinez AW, Phillips ST, Whitesides GM, Carrilho E. Analytical Chemistry. 2010;82:3–10. doi: 10.1021/ac9013989. [DOI] [PubMed] [Google Scholar]
- 47.Abe K, Suzuki K, Citterio D. Analytical Chemistry. 2008;80:6928–6934. doi: 10.1021/ac800604v. [DOI] [PubMed] [Google Scholar]
- 48.Irimia D, Geba DA, Toner M. Analytical Chemistry. 2006;78:3472–3477. doi: 10.1021/ac0518710. [DOI] [PMC free article] [PubMed] [Google Scholar]
- 49.Leighton T. The acoustic bubble. Academic press; 1994. [Google Scholar]
- 50.Lamminen MO, Walker HW, Weavers LK. J Membrane Sci. 2004;237:213–223. [Google Scholar]
- 51.Lim CS, Miller JN, Bridges JW. Analytical Biochemistry. 1980;108:176–184. doi: 10.1016/0003-2697(80)90709-5. [DOI] [PubMed] [Google Scholar]
- 52.Sasaki H, Onoe H, Osaki T, Kawano R, Takeuchi S. Sensors and Actuators B: Chemical. 2010;150:478–482. [Google Scholar]
- 53.Morisseau C, Wecksler AT, Deng C, Dong H, Yang J, Lee KS, Kodani SD, Hammock BD. Journal of lipid research. 2014;55:1131–1138. doi: 10.1194/jlr.M049718. [DOI] [PMC free article] [PubMed] [Google Scholar]
- 54.Borhan B, Mebrahtu T, Nazarian S, Kurth MJ, Hammock BD. Anal Biochem. 1995;231:188–200. doi: 10.1006/abio.1995.1520. [DOI] [PubMed] [Google Scholar]
- 55.Morisseau C, Schebb NH, Dong H, Ulu A, Aronov PA, Hammock BD. Biochemical and biophysical research communications. 2012;419:796–800. doi: 10.1016/j.bbrc.2012.02.108. [DOI] [PMC free article] [PubMed] [Google Scholar]
- 56.Przybyla-Zawislak BD, Srivastava PK, Vazquez-Matias J, Mohrenweiser HW, Maxwell JE, Hammock BD, Bradbury JA, Enayetallah AE, Zeldin DC, Grant DF. Molecular pharmacology. 2003;64:482–490. doi: 10.1124/mol.64.2.482. [DOI] [PubMed] [Google Scholar]
- 57.Smith PK, Krohn RI, Hermanson GT, Mallia AK, Gartner FH, Provenzano MD, Fujimoto EK, Goeke NM, Olson BJ, Klenk DC. Analytical Biochemistry. 1985;150:76–85. doi: 10.1016/0003-2697(85)90442-7. [DOI] [PubMed] [Google Scholar]
- 58.Walker JM. Methods in molecular biology. 1994;32:5–8. doi: 10.1385/0-89603-268-X:5. [DOI] [PubMed] [Google Scholar]
- 59.Warnick GR, Nauck M, Rifai N. Clinical chemistry. 2001;47:1579–1596. [PubMed] [Google Scholar]
- 60.Wang DY, Lu Q, Walsh SL, Payne L, Modha SS, Scott MJ, Sweitzer TD, Ames RS, Krosky DJ, Li H. Mol Biotechnol. 2008;39:127–134. doi: 10.1007/s12033-008-9050-y. [DOI] [PubMed] [Google Scholar]
Associated Data
This section collects any data citations, data availability statements, or supplementary materials included in this article.


