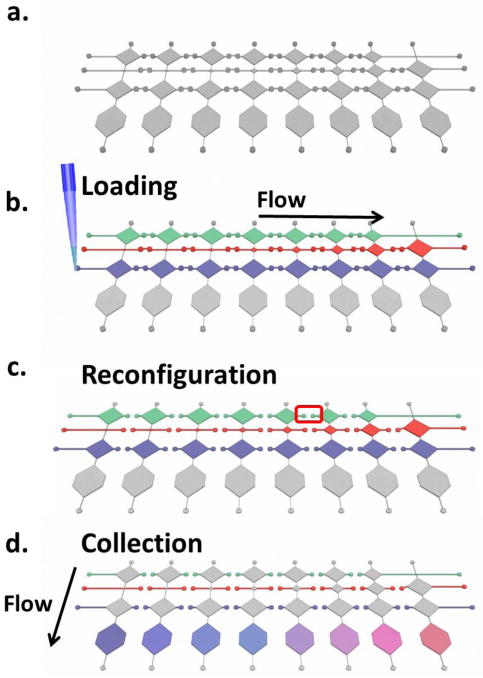
Fig. 2.

Illustrative procedures for dilution generation, where sample, diluent and detection reagent channels are shown from the top to the bottom in each figure. a) Device prior to the test. b) Sequential injection of diluent, sample, and detection reagent. c) Microfluidic reconfiguration. d) Metered liquids are driven to the final chambers and mix/react with each other to form dilution profiles.
