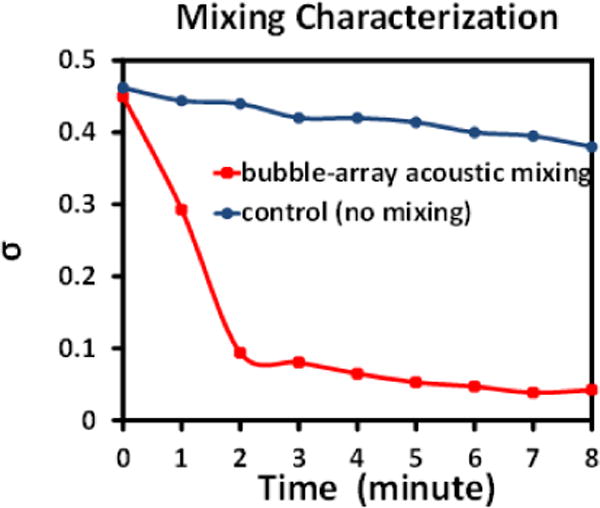
Fig. 4.

Plot of the standard derivation (σ) of the colour intensity in a reaction chamber with bubble-array acoustic microstreaming mixing, as a function of mixing time. The time-evolving data of a single continuous experiment was extracted from continuous snapshots at a 1-minute interval. Control group was plotted based on passive diffusion without acoustic mixing.
