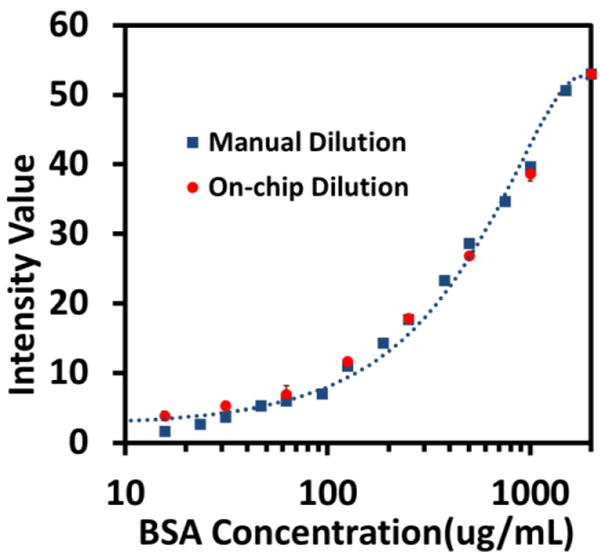
Fig. 8.

Calibration curve of quantitative BCA protein assay generated by both conventional manual dilution (blue squares) and the on-chip dilution (red dots) with a fitting curve of the manual dilution as a reference curve. Quantitative colorimetric readouts are characterized by the saturation intensity values vs BSA concentrations (in logarithmic scale) in which mean intensity values with standard derivation of 3 repeats are plotted.
