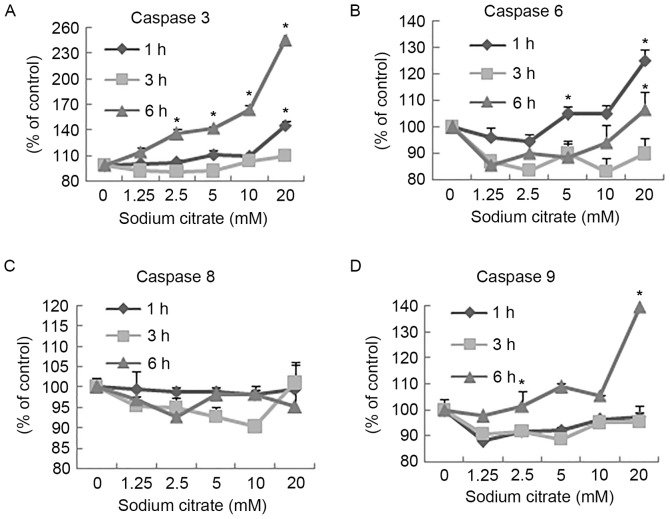
Figure 4.
Activities of (A) caspase-3, (B) caspase-6, (C) caspase-8 and (D) caspase-9 within AGS cells treated with the indicated concentrations of sodium citrate for 1, 3 or 6 h. Data are represented as the mean ± standard deviation. *P<0.05 vs. control. Statistical significance indicated by the asterisks.

