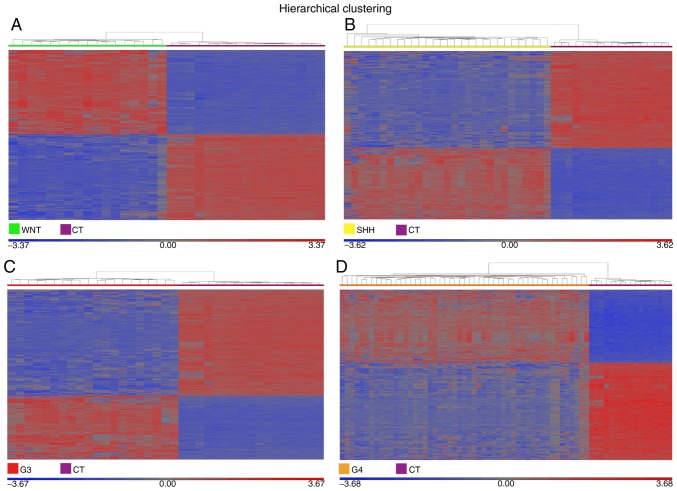
Figure 3.
Gene expression profiles associated with the molecular subgroups of medulloblastoma. The heatmaps illustrate the differentially expressed genes for the (A) WNT, (B) SHH, (C) G3 and (D) G4 subgroups, each compared with CT. The heat maps were constructed using the geometric least squares means model. Significant differential expression values were included only when the fold change was >5 or <-5 and the false discovery rate was <0.005. CT, control cerebellar tissue; G3, group 3 medulloblastoma; G4, group 4 medulloblastoma.

