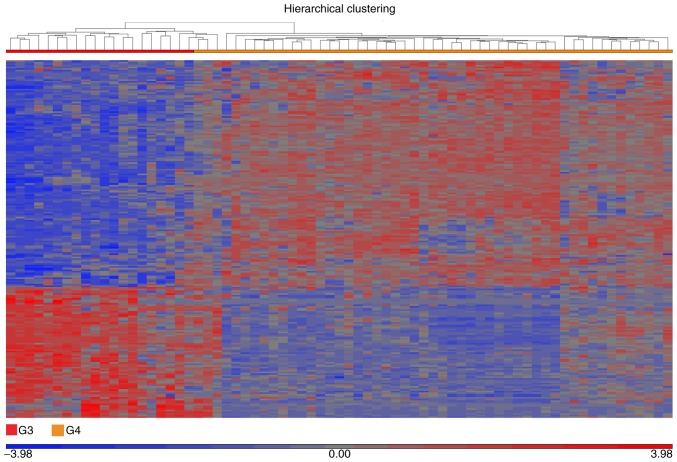
Figure 4.
Hierarchical clustering of the molecular subgroups G3 and G4. The heatmap depicts the differentially expressed genes in G3 compared with G4, as evaluated by analysis of variance using the geometric least squares means model, with G3 as the baseline. Differential expression was indicated when the fold change was >5 or <-5 and the false discovery rate was <0.005. Clustering analysis identified two subgroups within G4 based on the dissimilarity of samples as assessed using a Euclidean model by means of average linkage, which represented 48 tumors in total. A total of 12 G4 samples exhibited significantly different gene expression profiles compared with the remaining 36. G3, group 3 medulloblastoma; G4, group 4 medulloblastoma.

