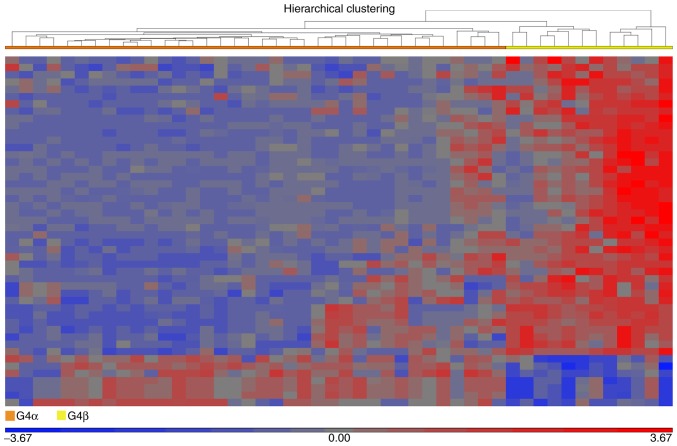
Figure 5.
Fractionation of G4 medulloblastoma. The heatmap illustrates 48 dysregulated genes in G4 medulloblastoma. The dissimilarity of samples based on average linkage indicated the fractionation of G4 into the potential subgroupings of G4α (left; orange bar) and G4β (right; yellow bar). Differential expression values were included when the fold change was >5 or <-5 and the false discovery rate was <0.005. G3, group 3 medulloblastoma; G4, group 4 medulloblastoma.

