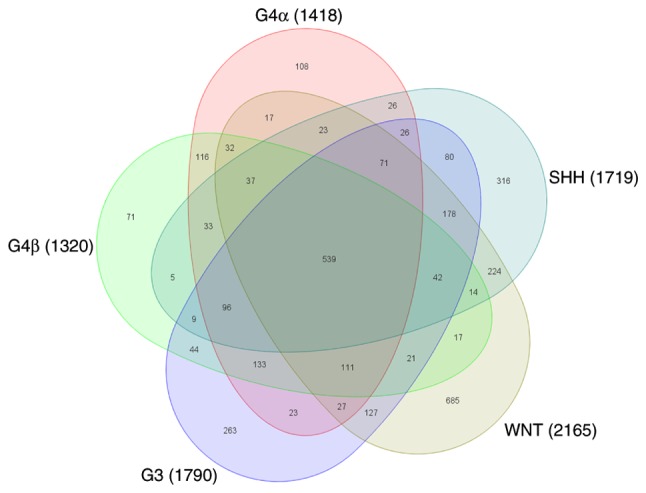
Figure 6.

Gene expression profiles associated with the molecular subgroups of medulloblastoma. The Venn diagram represents the 5 subgroups of medulloblastoma. A total of 539 dysregulated genes were common between the 5 subgroups. Distinct differentially expressed genes was identified for WNT (n=685), SHH (n=316), G3 (n=263), G4α (n=108) and G4β (n=71). G3, group 3 medulloblastoma; G4, group 4 medulloblastoma.
