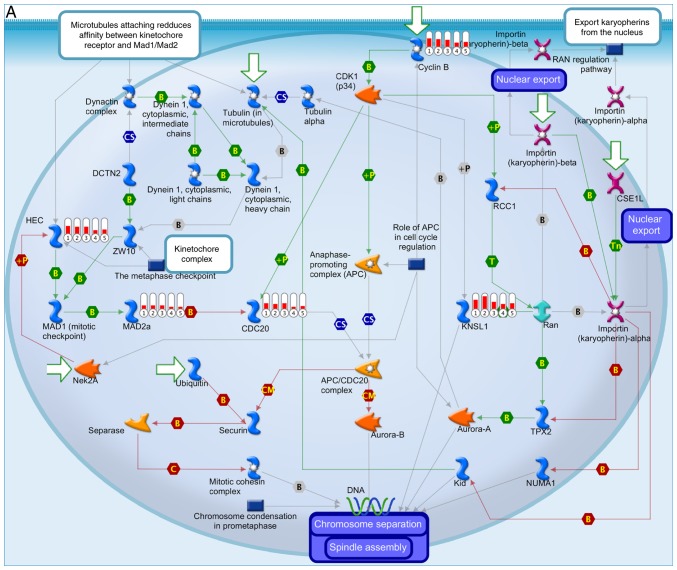
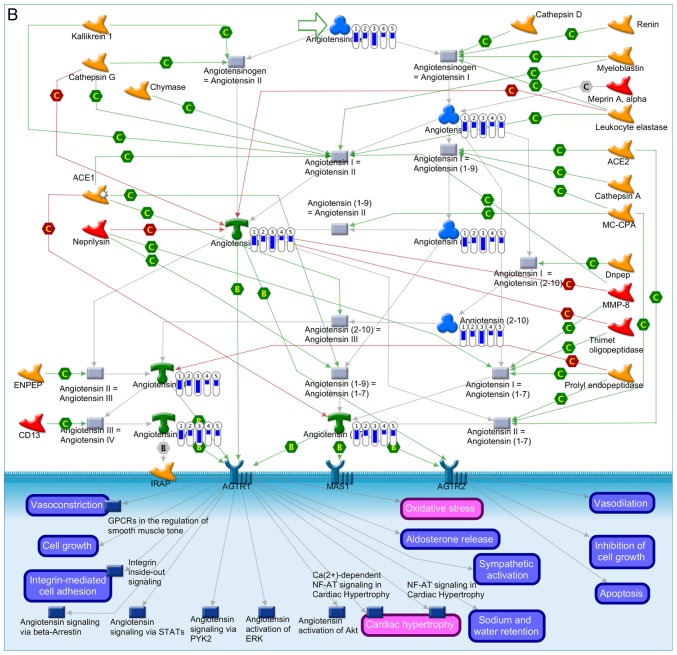
Figure 7.
Enrichment analysis of the differentially expressed genes in the 5 subgroups of medulloblastoma. The thermometers indicate expression (red, upregulated; blue, downregulated). The numbers in the thermometers indicate the molecular subgroups (1, WNT; 2, SHH; 3, group 3; 4, group 4α and 5, group 4β medulloblastoma). (A) Canonical pathways of the upregulated differentially expressed genes in the 5 molecular subgroups of medulloblastoma. (B) Canonical pathways of the downregulated differentially expressed genes in the 5 molecular subgroups of medulloblastoma.


