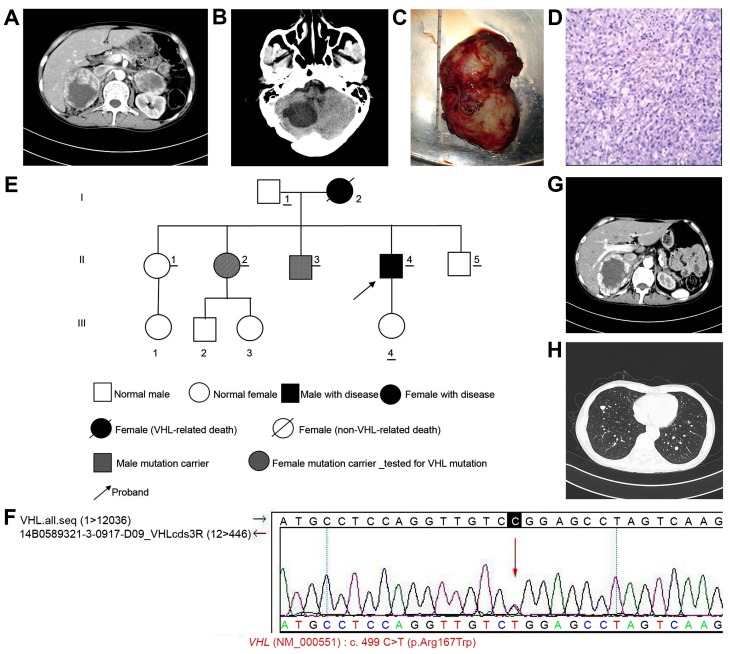
Figure 2.
Examination of case 2. (A) CT scan showing nodules in the left and right adrenal glands. Low-density areas and calcification shadows are also observable. A contrast-enhanced scan revealed that the solid portion of the mass was markedly enhanced, but the cystic region was not enhanced. (B) CT scan indicating cystic lesions or malacia in the right cerebellar hemisphere. The right occipital bone was altered following surgery. (C) Gross sample of the tumor obtained following surgery. (D) Hematoxylin and eosin staining indicating proliferation of a large amount of cells with rich cytoplasm in sections of left adrenal gland tissue. The cytoplasm was marginally eosinophilic, weakly stained or transparent and aligned in a nested shape. The nuclei were of varying sizes and were pleomorphic. There were numerous blood vessels with local infiltration of a large amount of eosinophils. Magnification, ×200. (E) Pedigree chart of case 2. (F) Confirmation of genetic test results in case 2 by Sanger sequencing. (G) Postoperative abdominal CT indicating an irregular mass (~92×73×105 mm) in the right adrenal gland, which appeared to be pheochromocytoma and adrenal carcinoma. The left adrenal gland was altered following surgery. (H) CT scan revealing multiple metastases in the left and right lungs. The diameter of the largest tumor was ~8.5 mm. CT, computed tomography; VHL, von Hippel-Lindau.

