Figure 2.
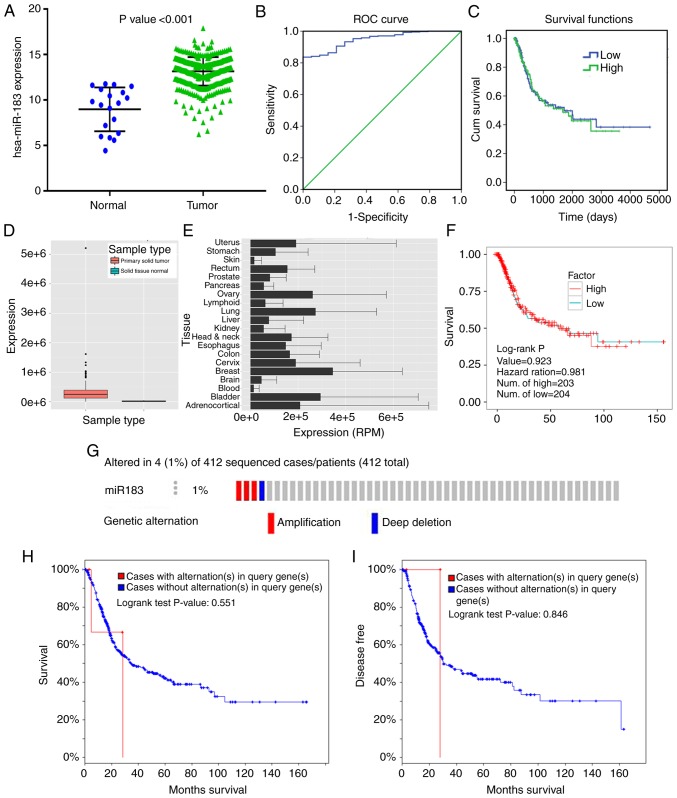
Clinical value of miR-183 in bladder cancer (BC) with different databases. (A) Expression data of miR-183-5p in normal and tumor tissues from TCGA (the y-axis represents log2 scaled). (B) Receiver operating characteristic (ROC) curve analysis of miR-183 to identify BC tissues from non-tumor bladder tissues based on TCGA dataset. (C) Kaplan-Meier survival curve of miR-183 for patients with BC. (D) Expression level of miR-183-5p in primary solid tumor and solid normal tissue from YM500v3 (http://driverdb.tms.cmu.edu.tw/ym500v3/). (E) Expression level of miR-183-5p in different cancers from YM500v3. (F) Relationship between miR-183-5p expression and overall survival by K-M curve analysis from YM500v3. (G) Genetic alterations of miR-183 in BC from cBioPortal (http://www.cbioportal.org). (H) Relationship between the alteration of miR-183 and overall survival from cBioPortal. (I) Disease-free survival from cBioPortal.

